Figure 2.

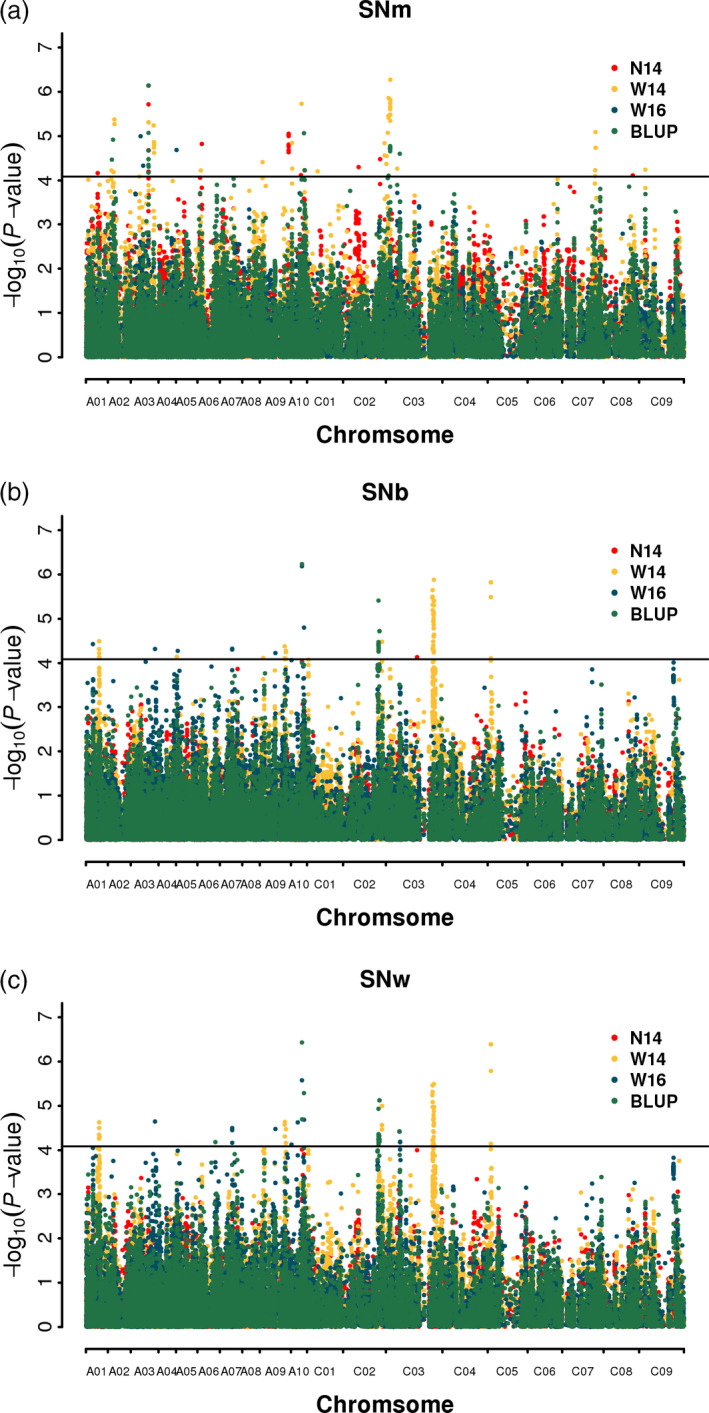
Manhattan plots generated from GWAS results for silique number from the main inflorescence (a), branch inflorescence (b) and whole plant (c).

Manhattan plots generated from GWAS results for silique number from the main inflorescence (a), branch inflorescence (b) and whole plant (c).