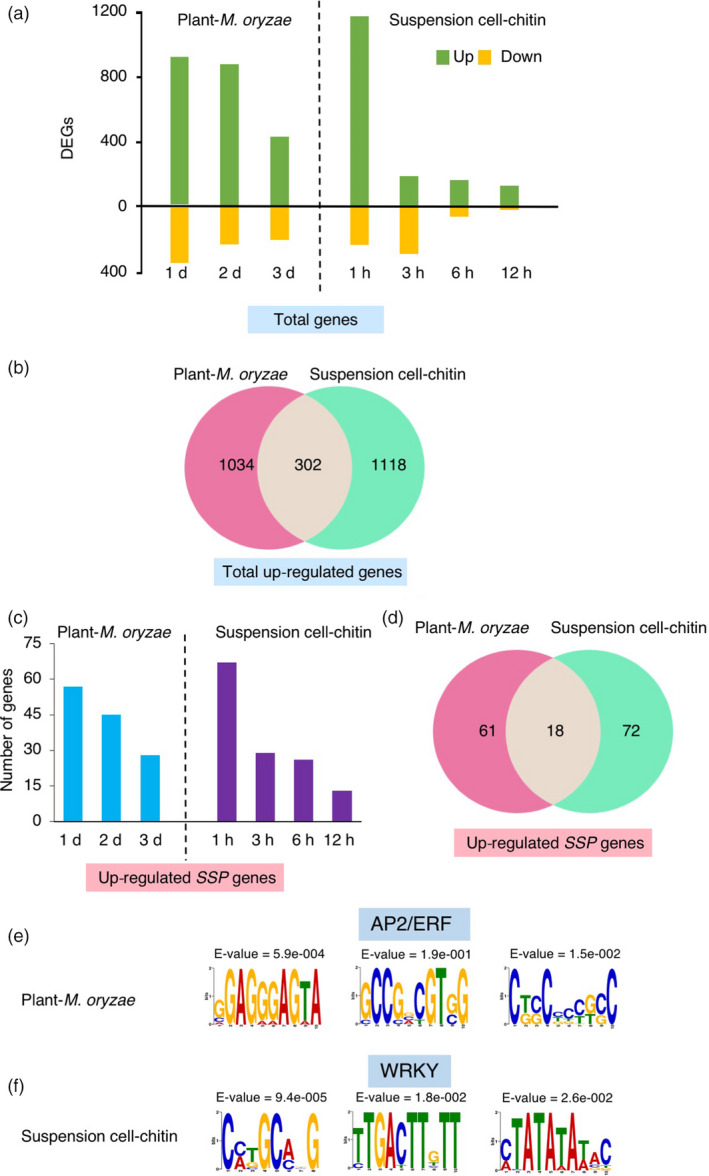
Figure 2.

SSPs identified by transcriptome analysis. (a) Number of differentially expressed genes (DEGs) (>2‐fold change, FDR < 0.05) in plants and suspension cells. Yellow and green bars indicate down‐regulated and up‐regulated genes, respectively. (b) Venn diagram showing the overlapping up‐regulated genes between plants and suspension cells. (c) Number of up‐regulated SSP genes (>2‐fold change, FDR < 0.05) in plants and suspension cells, respectively. (d) Venn diagram showing the overlapping up‐regulated SSP genes between plants and suspension cells. (e and f) cis‐regulatory elements identified in the promoter regions of the up‐regulated 79 SSP genes induced in rice plants infected with blast fungus (e) and the 90 up‐regulated SSP genes induced in suspension cells treated with chitin (f).
