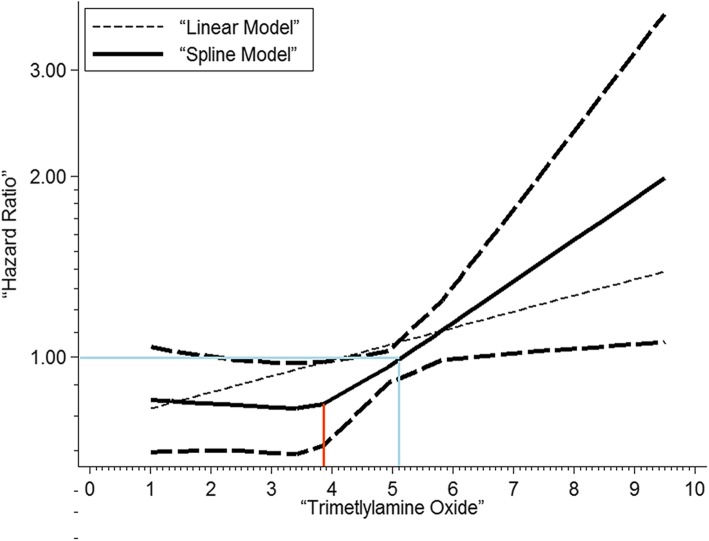
Fig. 3.
Concentration-risk analysis between plasma concentrations of TMAO and HR for MACE in patients with CHD. Used a restricted cubic splines in a non-linear random-effects model The solid line and the long dashed line represents the estimated HR and its 95% CI of the nonlinear relationship, while the short dashed line represents the linear relationship. Before the red line, the curve of HR tends to be flat, whereas after the blue line, the curve tends to be steep, and TMAO presents as a risk factor for MACE. CHD, coronary heart diseases; CI, confidence interval; HR, hazard ratio; MACE, major adverse cardiovascular event; TMAO, trimethylamine-N-oxide

