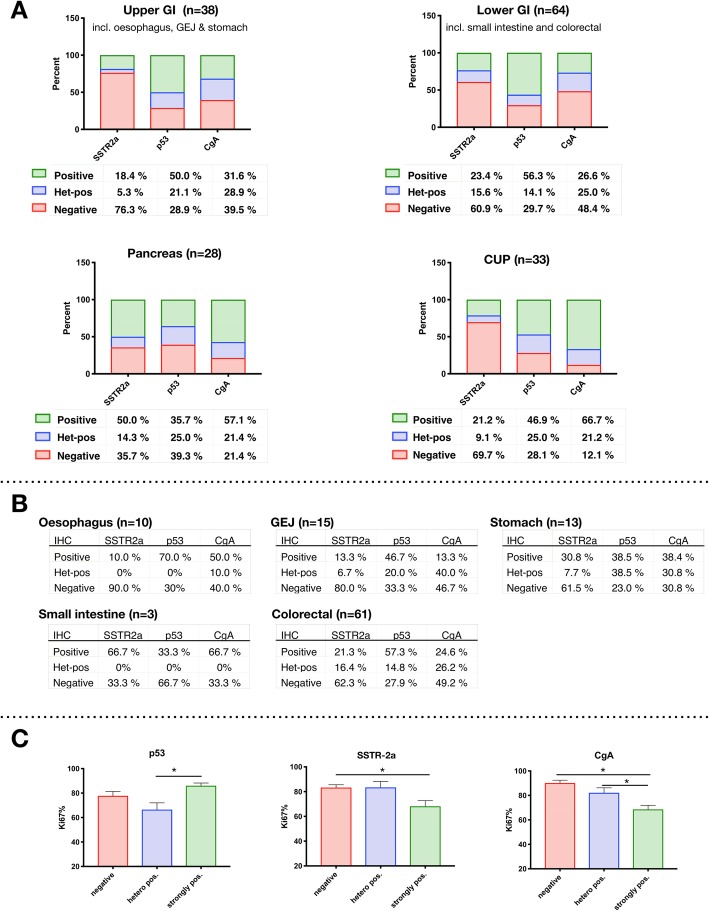
Fig. 2a-c.
The immune-markers SSTR-2a, p53 and CgA in relation to origin of primary tumour and Ki67. a: Percentages for each marker is shown beneath each bar. For SSTR-2a, p53 and CgA the number of patients for upper GI is 38, for lower GI 64, for pancreas 28 and for CUP 33; except for p53, which are 32 due to one missing analysis. Differences in distribution of the immune-markers are visualised according to primary tumour. b: The distribution of immunomarkers for the specific localisation of the primary tumor is presented. c: The Ki67-index compared to the staining pattern of p53, SSTR-2a and CgA

