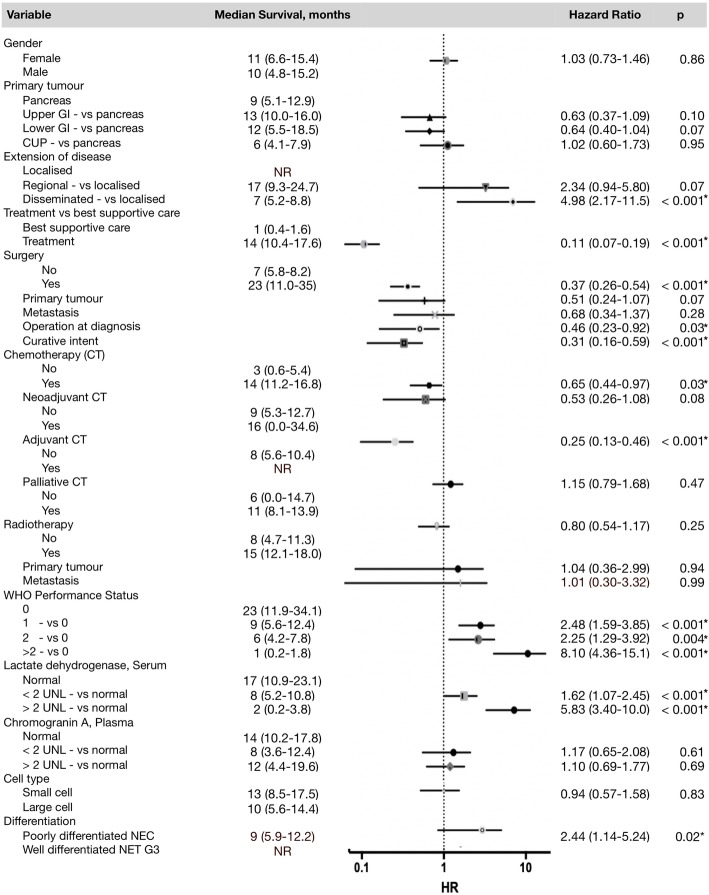
Fig. 3.
Univariate survival analyses of prognostic parameters in 163 patients. Median survival in months are shown for each parameter, as well as HRs with CI and p-values. The 95% confidence intervals are shown as horizontal lines. CI’s crossing the line at HR = 1 are non-significant. The dot on each line indicates the HR. NR = not reached. *Indicates significant p-values < 0.05

