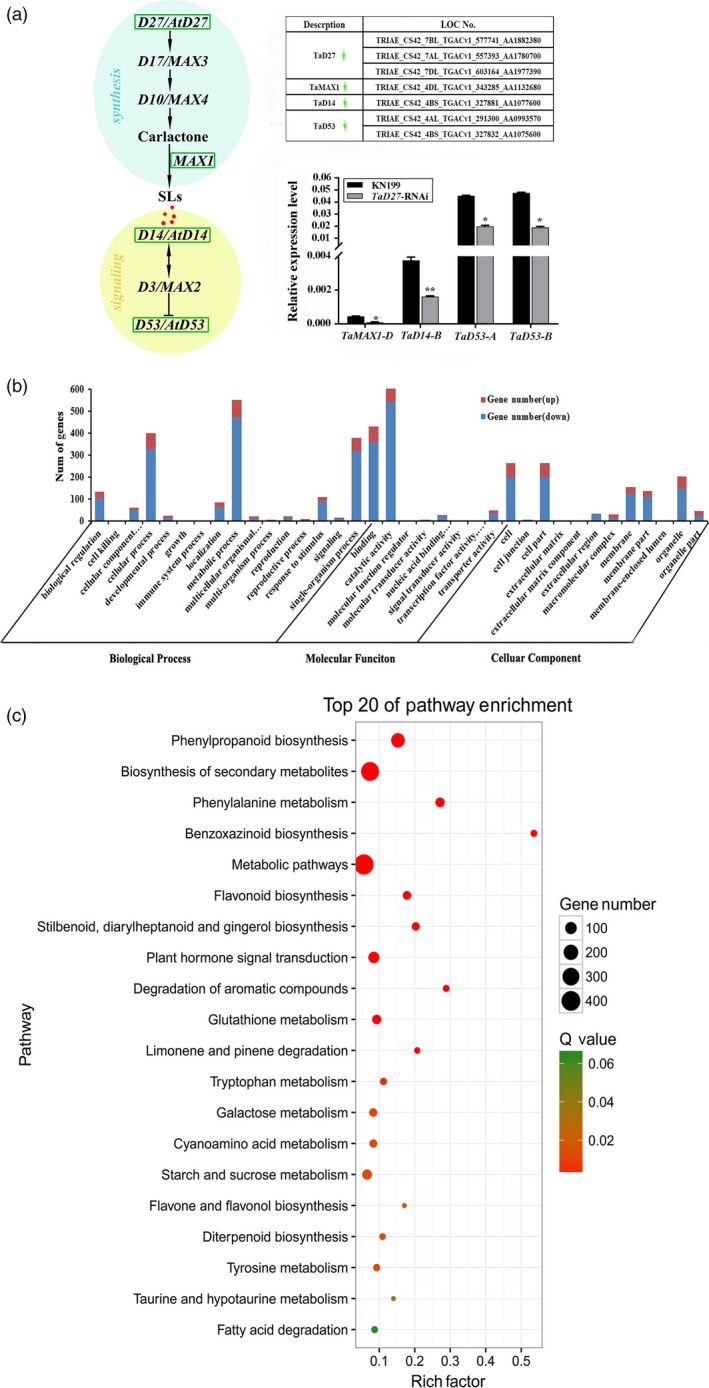
Figure 6.

(a) SLs biosynthesis and signalling pathway‐related genes in the DEGs. Single and double asterisks represent significant differences between wild‐type and TaD27‐RNAi‐transgenic plants in Student's t‐test at P < 0.01. (b) Classification of the DEGs by GO analysis. (c) Scatter plots of KEGG pathway‐enrichment statistics. The top 20 enriched pathways are shown.
