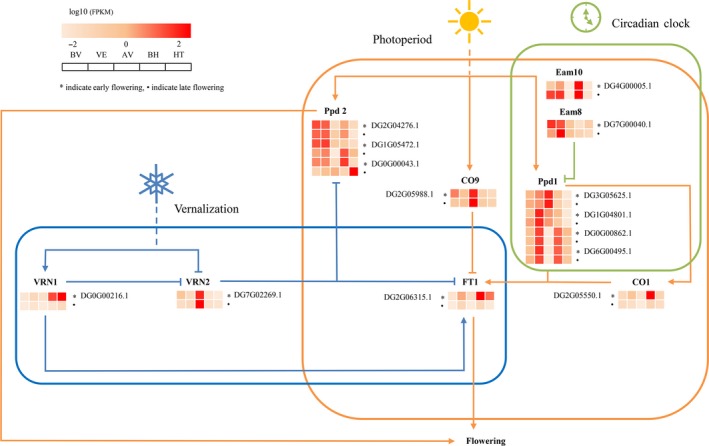
Figure 4.

A simplified representation of the flowering pathway in D. glomerata. The blue, orange and red lines indicate genes related to the vernalization pathway, photoperiod pathway and circadian clock pathway, respectively. Arrows indicate positive regulation, and lines with bars indicate negative regulation. The heatmap shows the relative expression of candidate genes in different stages. Early and late phenotypes are indicated by asterisks and dots, respectively.
