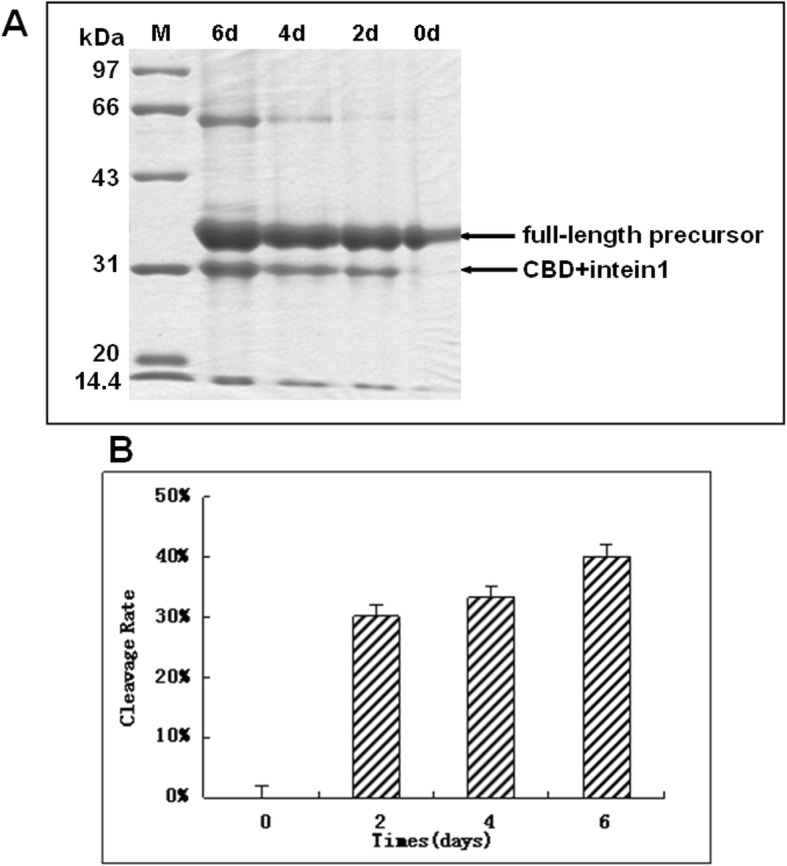
Fig. 3.

Rate of CI-DPIP cleavage increases then slows down after two days. a: SDS-PAGE analysis of cleavage with different incubation time. Lanes 1–3 indicate resin after incubation of 6 days, 4 days and 2 days, respectively, and lane 4 indicates the input precursor without any cleavage (0d). Since the precursor is chemically stable in solution, so Lane 4 shows no CBD + intein fraction, M: molecular weight markers. b: Quantified cleavage ratio. All assays were carried out in triplicate and the average was used in this study; the error bars show standard deviations
