
Fig. 4.
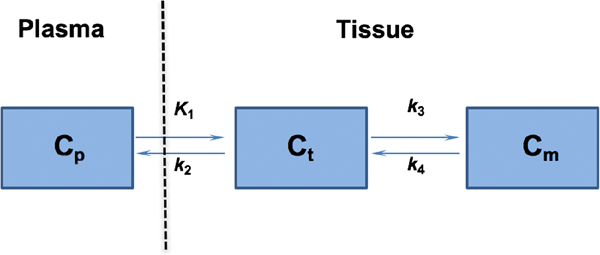
The 2-tissue, 4-kinetic-parameter model used for describing [18F]VUIIS1018A kinetics in reference tissues, including tumor and brain. In this model, Cp represents the concentration of [18F]VUIIS1018A in the plasma. Ct represents non-specific and free tracer in the tissue. Cm represents the specific binding of the tracer to TSPO in the outer-mitochondria membrane. The four parameters of K1, k2, k3, and k4 reflect the transport or binding rates of the tracer. In this specific study, K1 indicates the perfusion rate of the probe from plasma to tissue, while k2 reflects the clearance rate for the tracer from tissue to plasma. k3 and k4 represent the specific binding rates and dissociation rates of the tracer, respectively.