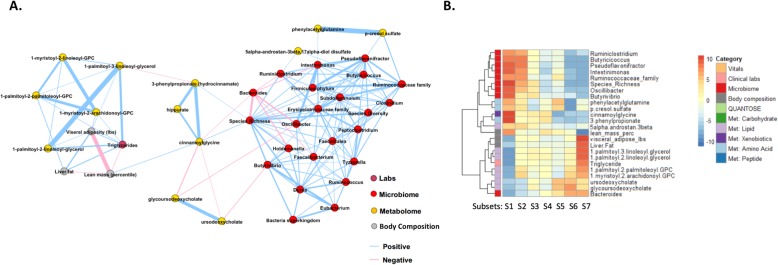
Fig. 5.
The microbiome richness module. a We built a Markov network to identify the key biomarker features that represent the microbiome richness module. Most of the associations between the microbiome and the metabolome were mediated by species richness. b We clustered individuals using the key biomarkers. The heatmap shows z-statistics from logistic regression for an association between each cluster and each feature. The plot on the left shows the 24 key biomarkers representing the module. Met, metabolome

