
5.
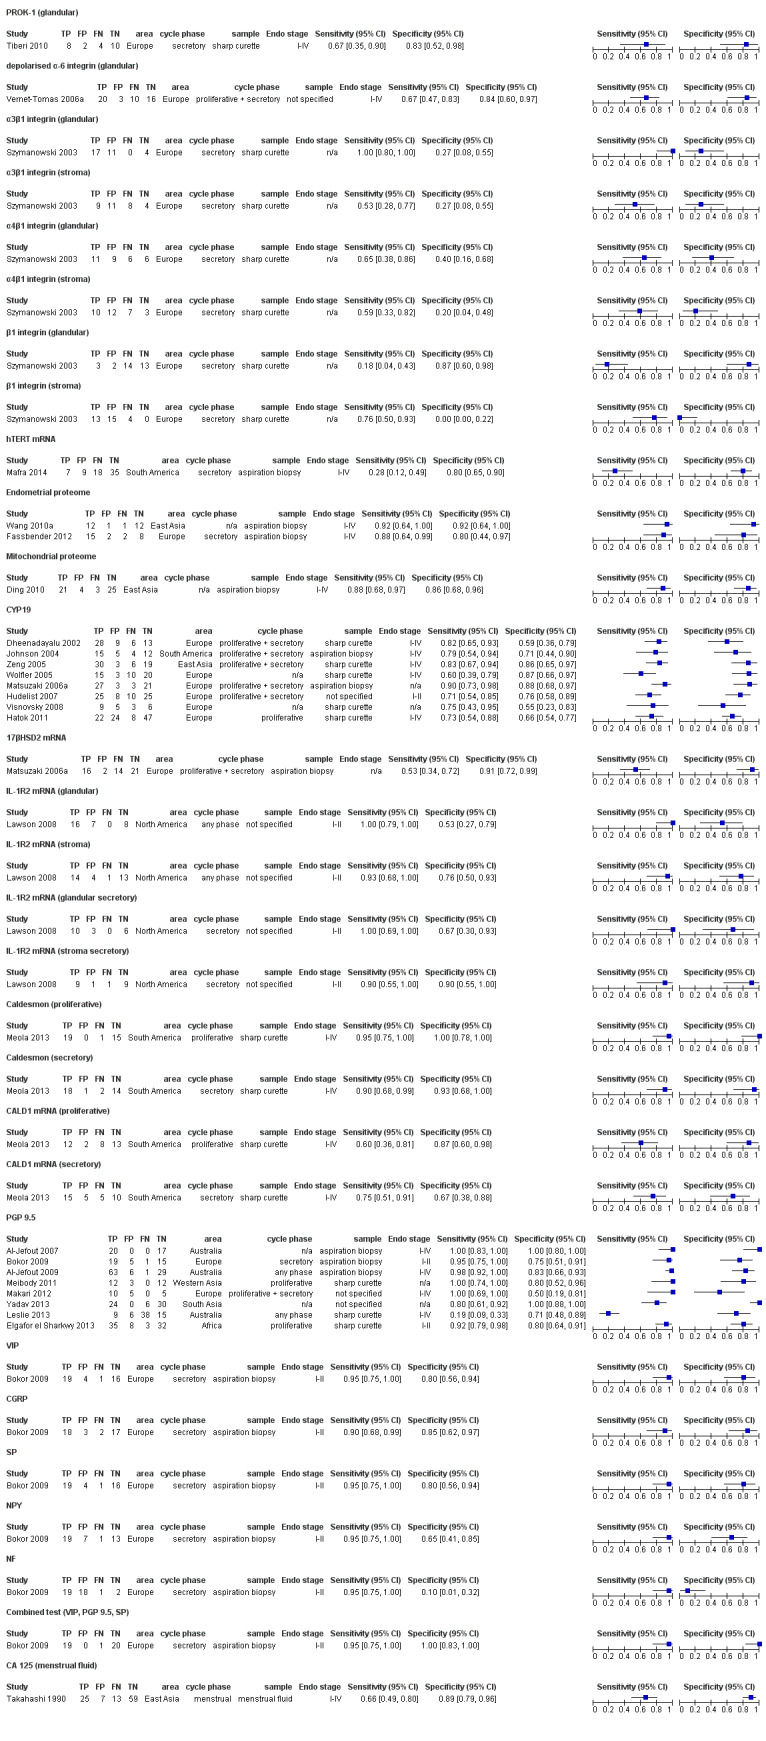
Forest plot of all endometrial biomarkers evaluated for detection of pelvic endometriosis. Plot shows study‐specific estimates of sensitivity and specificity (squares) with 95% CI (black line) along with country in which the study was conducted, stage of menstrual cycle when tissue was collected, method of sample collection and stage of endometriosis assessed. The studies for each test are ordered according to the year of publication. FN: false negative; FP: false positive; TN: true negative; TP: true positive.