
5.
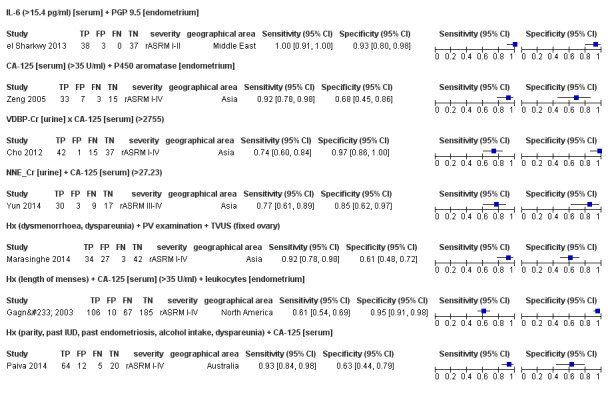
Forest plot of the combined tests for detection of pelvic endometriosis. Plot shows the estimates of sensitivity and specificity (squares) with 95% CI (black line) specific for each evaluation (each evaluation was derived from a single study), country in which the study was conducted and severity of the disease assessed by each study, reported as rASRM stage. FN: false negative; FP: false positive; TN: true negative; TP: true positive.