
11.
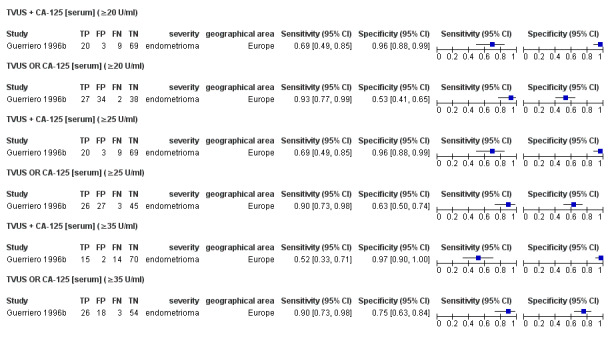
Forest plot of the combined tests (TVUS and/or CA‐125 at varying thresholds) for differentiation of ovarian endometriosis vs. other benign ovarian cysts. Plot shows the estimates of sensitivity and specificity (squares) with 95% CI (black line) specific for each evaluation (each evaluation was derived from a single study Guerriero 1996b), country in which the study was conducted and target condition assessed by each study. FN: false negative; FP: false positive; TN: true negative; TP: true positive.