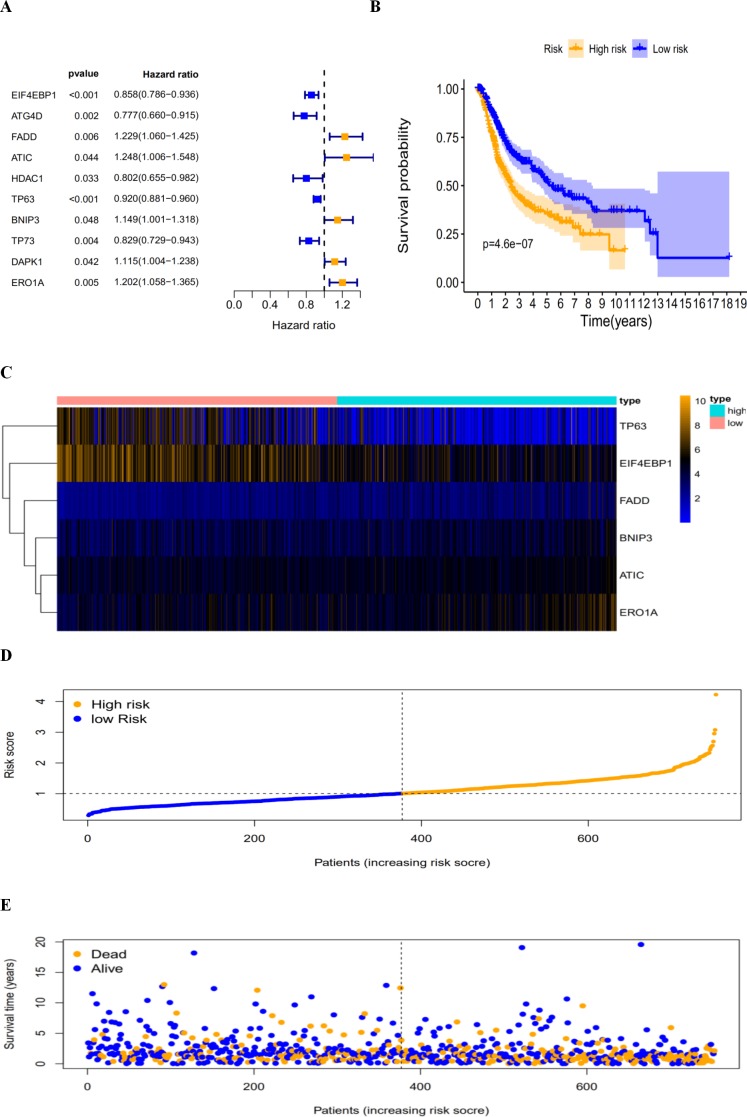
Figure 5. The autophagy-related prognostic index (PI) of LUAD and LUSC patients.
The autophagy-related prognostic index (PI) of LUAD and LUSC patients. (A) The univariate Cox regression analysis revealed the pool of the prognosis-related genes. (B) The K-M plot represented that the high-risk group had shorter DFS than the low-risk group; (C) the heatmap of the six signature genes expression profiles; (D) the number of patients in different risk group; (E) the DFS of patients in the TCGA dataset. The orange color indicates a higher risk score and the blue color indicates a lower risk score.

