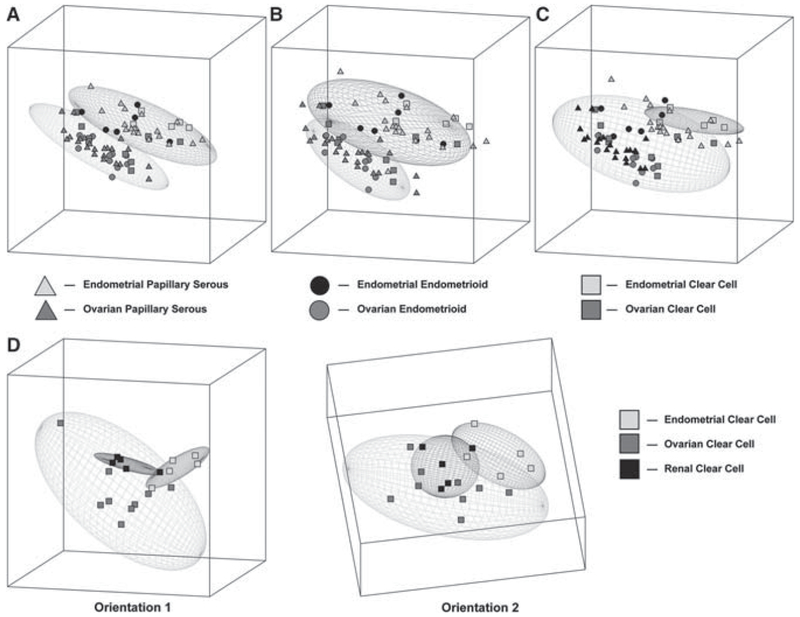
Fig. 2.
Graphic depiction of the principal component analysis of ovarian and endometrial cancers categorized by histology. The ellipses represent a region where an additional sample of particular groups would fall with a 95% confidence interval. a. Analysis of serous tumors demonstrates nonoverlapping ellipses separating endometrial (top) and ovarian (bottom) specimens. b. Analysis of endometrioid tumors demonstrates nonoverlapping ellipses separating endometrial (top) and ovarian (bottom) specimens. c. Analysis of clear cell tumors showing overlapping of endometrial (top) and ovarian (bottom) specimens. d. Analysis of clear cell tumors of ovarian, endometrial, and renal origin demonstrate three overlapping elliptical regions, with two different orientations (1 and 2)

