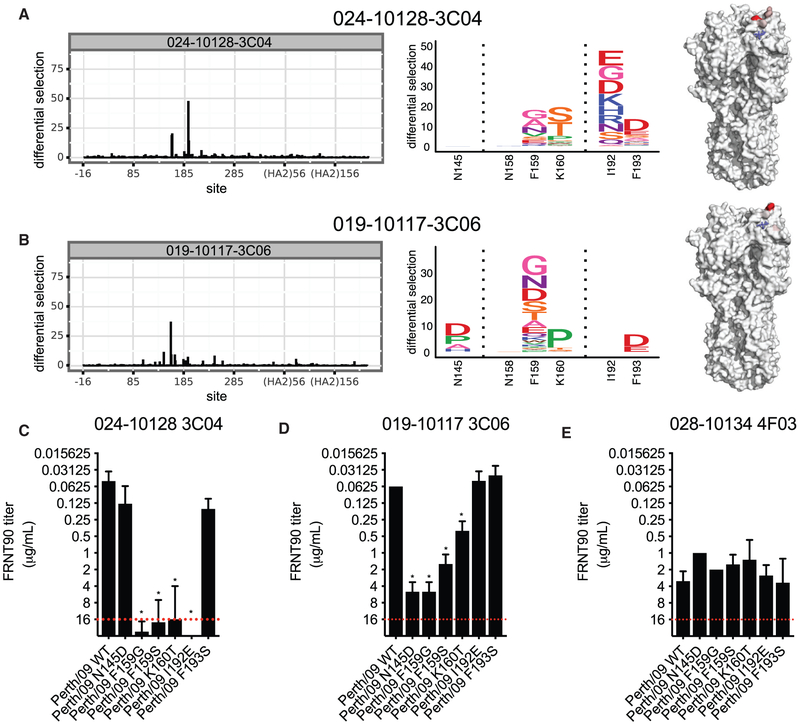
Figure 4. Mutational Antigenic Profiling of mAbs Targeting Antigenic Site B and the RBS.
Deep mutational scanning experiments were completed to identify resistant viral fractions that survived after mAb selection.
(A and B) Logo plots showing the selection of amino acid substitutions and locations of these substitutions on the HA structure after selection with the 024-10128-3C04 mAb (A) and the 019-10117-3C06 mAb (B).
(C–E) Neutralization assays were completed with viruses that had several of the substitutions identified in deep mutational scanning experiments. Each panel shows neutralization of a single mAb against WT virus and viral mutants identified by mutational antigenic profiling. A red dashed line indicates the limit of detection (each mAb was tested at a starting concentration of 16 μg/mL). Neutralization titers shown are the geometric mean, and error bars denote the geometric SD of three independent experiments. Statistical analyses of differences between neutralization (FRNT) titers against WT and mutant viruses were done using a one-way ANOVA with Dunnett’s test for multiple comparisons. *p < 0.05.

