
5.
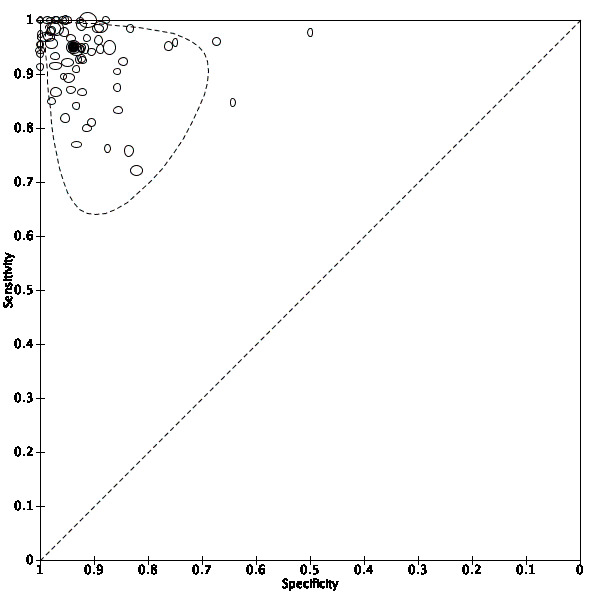
Summary ROC plot of CT for diagnosis of acute appendicitis (any contrast enhancement and radiation dose). The hollow symbols represent the pairs of sensitivity and specificity from the included studies; the symbols are scaled according to sample sizes of the studies. The solid circle represents the summary sensitivity and specificity. This summary point is surrounded by a 95% prediction region (interrupted line).