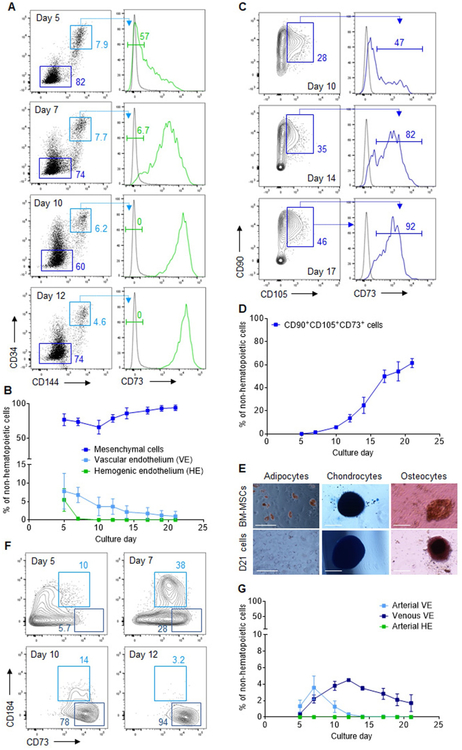
Fig. 3.
Abundant mesenchymal cells and limited arterial endothelium formation during human iPSC differentiation. (A) Representative flow cytometry plots for CD34, CD144 (VE-cadherin) and CD73 expression in gated CD43−CD45− non-hematopoietic cells at various days of differentiation. Gates shown include: CD144−CD34− mesenchymal cells (dark blue), CD144+CD34hi vascular endothelium (VE, light blue), and CD144+CD34hiCD73− hemogenic endothelium (HE, green). The complete gating strategy is shown in Fig. S1C. (B) Percentage of cells with a mesenchymal, VE or HE immunophenotype within the non-hematopoietic fraction at various days of differentiation (n = 3). (C) Representative flow cytometry plots of CD90, CD105 and CD73 expression in gated CD144−CD34− mesenchymal cells at various days of differentiation. The complete gating strategy is shown in Fig. S1 D. (D) Percentage of cells with a CD90+CD105+CD73+ mesenchymal stromal cell (MSC) immunophenotype within the CD43−CD45−non-hematopoietic fraction at various days of differentiation (n = 3). (E) Representative images depicting adipocyte (Oil Red O stain), chondrocytes (Alcian Blue stain), and osteocytes (Alizarin Red stain) after culture of control BM-derived MSCs (top panels) or day 21 sorted CD43−CD45− cells (bottom panels) under conditions promoting differentiation of each cell type (n = 2). Scale bar = 100 μm (adipocytes panels) or 200 μm (chondrocytes and osteocytes panels). (F) Representative flow cytometry plots for CD184 and CD73 expression in gated CD144+CD34hi VE cells. Gates shown include: CD73midCD184+ arterial VE (light blue), and CD73hiCD184− venous VE (dark blue). The complete gating strategy is shown in Fig. S1E. (G) Percentage of cells with an arterial VE, venous VE or arterial HE immunophenotype within the non-hematopoietic fraction at various days of differentiation (n = 3). In panels (B), (D), and (G), results are displayed as mean ± SEM. (For interpretation of the references to colour in this figure legend, the reader is referred to the web version of this article.)

