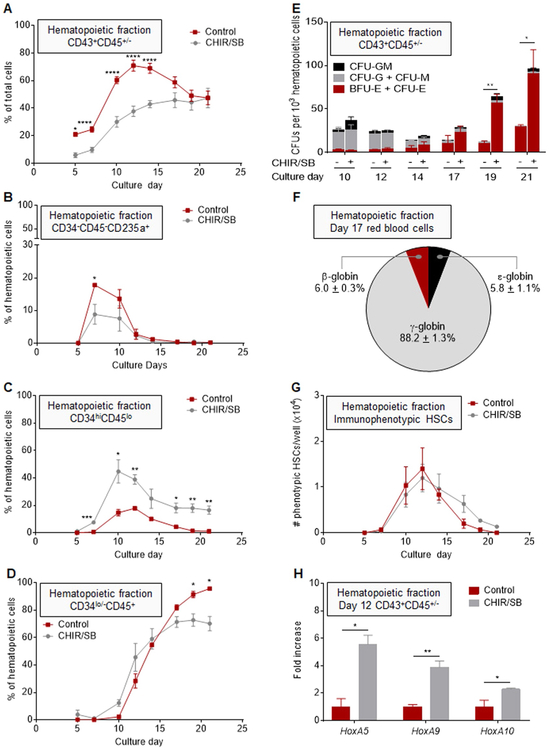
Fig. 5.
CHIR/SB molecules suppress primitive hematopoiesis and promote definitive HSPC formation during human iPSC differentiation. (A) Percentage of CD43+CD45+/− hematopoietic cells in control and CHIR/SB-supplemented cultures at various days of differentiation (n = 8). (B) Percentage of CD34−CD45−CD235a+ primitive erythroid progenitor cells within the hematopoietic fraction of control and CHIR/SB-supplemented cultures at various days of differentiation (n = 5). (C) Percentage of CD34hiCD45lo multilineage HSPCs within the hematopoietic fraction of control and CHIR/SB-supplemented cultures at various days of differentiation (n = 5). (D) Percentage of CD34lo/−CD45+ hematopoietic progenitors within the hematopoietic fraction of control and CHIR/SB-supplemented cultures at various days of differentiation (n = 5). (E) CFU counts per 1 × 10³ CD43+CD45+/− hematopoietic cells sorted from control and CHIR/SB-supplemented cultures at various days of differentiation (n = 8). (F) Percentage of β-globin series expression measured by RP-HPLC in erythroid cells differentiated from day 17 hematopoietic cells of CHIR/SB-supplemented cultures (n = 2). (G) Absolute numbers of CD34+CD38−CD45RA−CD90+CD49f+ cells within the CD43+CD45+ hematopoietic fraction arising from 20 to 35 iPSC clusters (one well of a 12-well plate) in control and CHIR/SB-supplemented cultures at various days of differentiation (n = 3). (H) Fold increase in HOXA gene expression measured by real-time qPCR in CD43+CD45+/− hematopoietic cells sorted from CHIR/SB-supplemented cultures at D12 of differentiation relative to the same population sorted from control cultures (n = 3). Results are displayed as mean ± SEM; *P < 0.05, **P < 0.01, ***P < 0.001, ****P < 0.0001, by two-way unpaired Student’s t-tests comparing percentages (A-D), CFU counts (E), cell numbers (G), or day 7 untransformed ΔCT values (H) in control vs CHIR/SB groups at each culture day.

