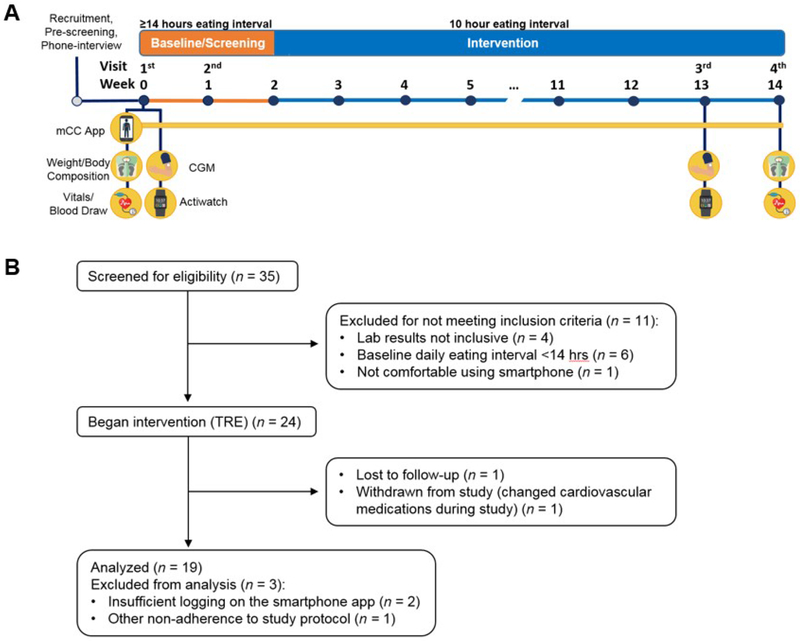
Figure 1. Study Design and CONSORT flow diagram.
(A) Study design. Prior to baseline, participants were screened with a phone interview. At the first visit (day 1), questionnaires, vitals, and blood were collected. Participants also had the CGM applied, were given an actiwatch, and were trained how to use the myCircadianClock (mCC) app. Week 0-1: Participants wore the CGM and actiwatch, and logged all food and beverages on the mCC app. mCC data were used to screen participants for a ≥ 14 h eating interval. At visit 2 (~day 7) the CGM was removed and the actiwatch was returned. At the end of week 2, if participants qualified for the study, they were instructed to select a 10 h eating window and start their 12-week time-restricted eating intervention. The mCC app was used throughout intervention to log food and beverage intake and sleep. 7-10 days before the end of intervention, participants came for the 3rd visit and had another CGM applied and were provided an actiwatch. At visit 4, the CGM was removed, the actiwatch was returned, and all assays taken at baseline were repeated. CGM, continuous glucose monitor. mCC, myCircadianClock smartphone app. (B) CONSORT flow diagram describing the process of patient enrollment, intervention, and data analysis. TRE, time-restricted eating.

