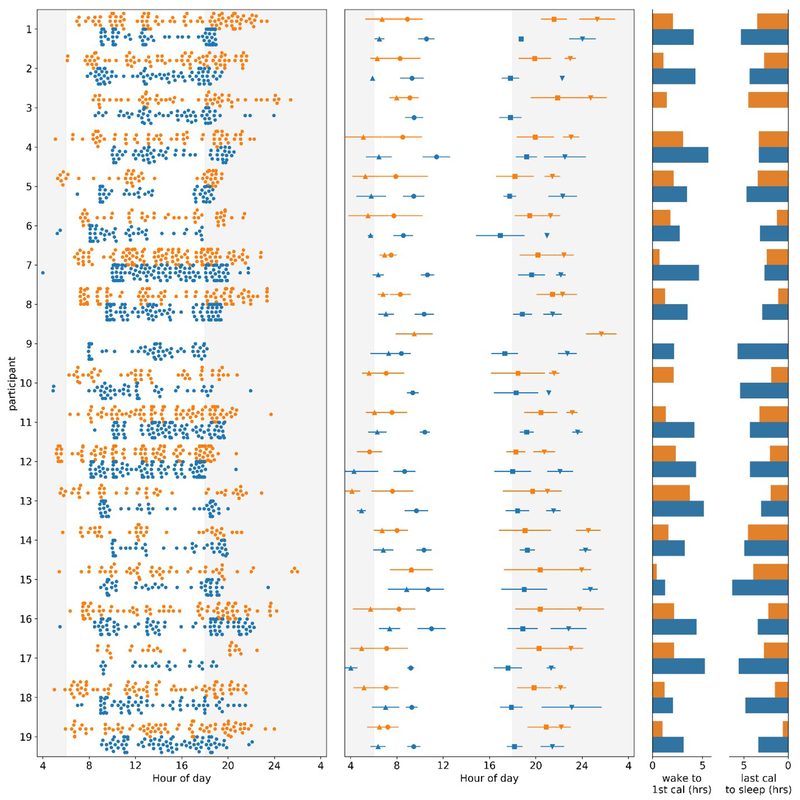
Figure 2. Variance in time of first and last calorie and sleep and wake times decreases in TRE intervention.
For all panels, baseline data is in orange, and intervention in blue. Y-axis: each orange/blue combination represents an individual participant. For the left and middle panels, X-axis: clock hour for eating event (4=4AM, 24=midnight). Left Panel: All food and beverage events from two weeks of baseline and the last two weeks of TRE intervention for each participant. Data from each two-week interval was randomly sampled to have the same number of entries at baseline and end of intervention. Middle Panel: Mean and standard deviation for first calorie (●), last calorie (■), wake (▲), and sleep onset (▼) at baseline and intervention. First and last calorie data was only used for days that logging adherence was met. Right Panel: Mean time (in h) between wake and first calorie (left) and last calorie and sleep onset (right) at baseline and intervention. Data were analyzed for each day that the watch was worn and logging adherence was achieved, and then averaged. Note: missing data for participant 9 (eating times at baseline) and participant 3 (sleep times at intervention).

