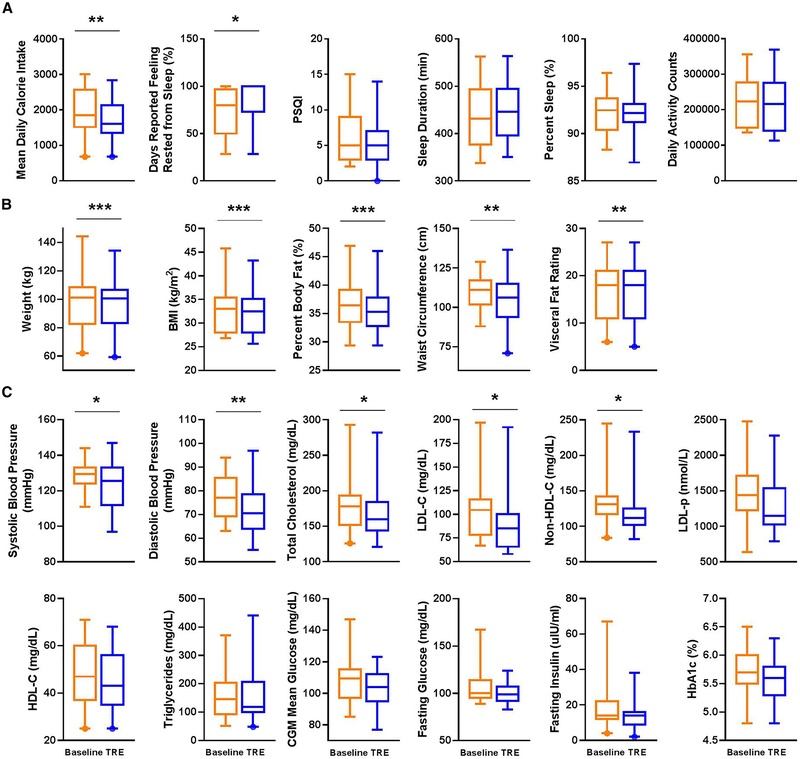
Figure 3. TRE intervention improves restfulness and body composition and significantly reduces weight, blood pressure, and atherogenic lipids.
(A) Mean daily caloric intake, sleep parameters, and activity counts at baseline (orange) and end of 12-weeks of time-restricted eating (TRE) intervention (blue). (B) Weight and body composition end-points, (C) blood pressure, lipid, and glucose end-points. Box plot with whiskers displaying 5-95% interval and outliers. *p<0.05, **p<0.01, ***p<0.001. PSQI, Pittsburgh Sleep Quality Index. BMI, body mass index, HDL-C, high-density lipoprotein cholesterol, LDL-C, low-density lipoprotein cholesterol, LDL-p, low-density lipoprotein particle number, CGM, continuous glucose monitor, HbA1c, hemoglobin A1c.

