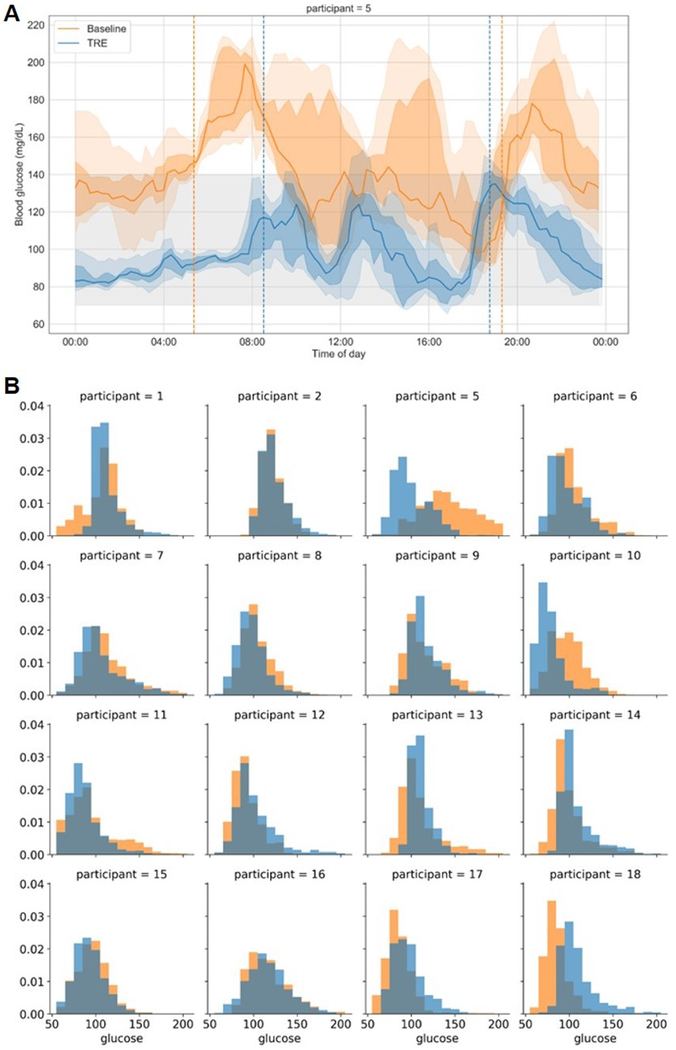
Figure 4. Changes in glucose levels between baseline and end of intervention.
(A) Summary of 8 days of CGM data baseline (orange) and at the end of 12-weeks of TRE intervention (blue) for a participant with type 2 diabetes mellitus. Solid lines represent the median glucose, the shaded area is 25-75% interval, and the lightly shaded area is 10-90% interval. Vertical dotted lines represent the 95% eating interval at baseline and intervention. The eating window goal during intervention was 8 am to 6 pm. This participant had baseline fasting glucose of 167 mg/dL and post-TRE fasting glucose of 116 mg/dL. Baseline fasting and continuous mean glucose data were higher than other participants, and thus this is not representative of all participants, but rather shows the large change observed in an individual with type 2 diabetes mellitus. (B) Distribution of glucose assessed by CGM for 16 of the 19 participants. Three participants are not included because they did not have at least 4 days of CGM data at either time point. Summary of 8 days of CGM data at baseline (orange) and end of TRE intervention (blue) for each participant.

