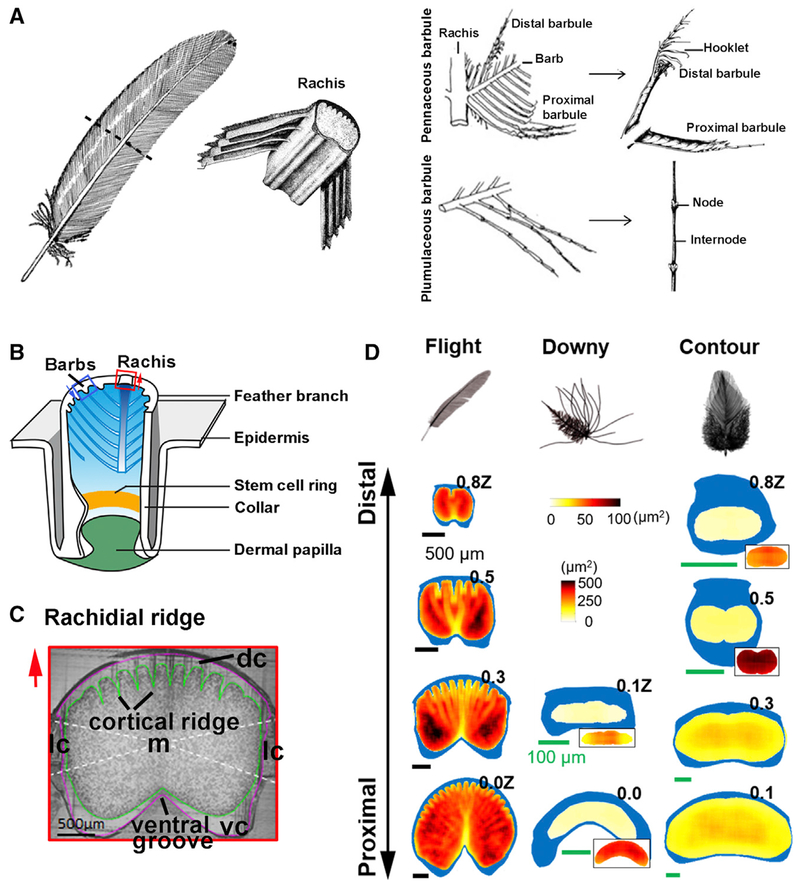
Figure 1. The Cellular Mechanism Guiding the Making of a Feather.
(A) Chicken feather schematic, with enlargement of the rachis, pennaceous barbule, and plumulaceous barbule (Lucas and Stettenheim, 1972).
(B) Growth phase feather follicle structure. Stem cell ring in the collar region (yellow stripe). Blue arrows indicate barb ridge orientation.
(C) Chicken flight feather rachis cross-section showing its composition. Cortex is divided into four regions (white dashed lines). Green line surrounds the medulla. Purple line outlines the rachis. Red arrows in (B) and (C) indicate rachis orientation.
(D) Rachis organization along the proximal-distal axis in flight, downy, and contour feathers. The rachis is parameterized along the z-axis (z), where z = 0 at SUR (superior umbilical region, junction of the calamus, and rachis) and z = 1.0Z at the distal tip of the rachis. Cortex is depicted in blue. Medulla cell organization is quantified by QMorF measurements. Vertical PS scale is for the main figures, and horizontal PS scale is for the insets. dc, dorsal cortex; lc, lateral cortex; m, medulla; vc, ventral cortex.
See also Figure S1.

