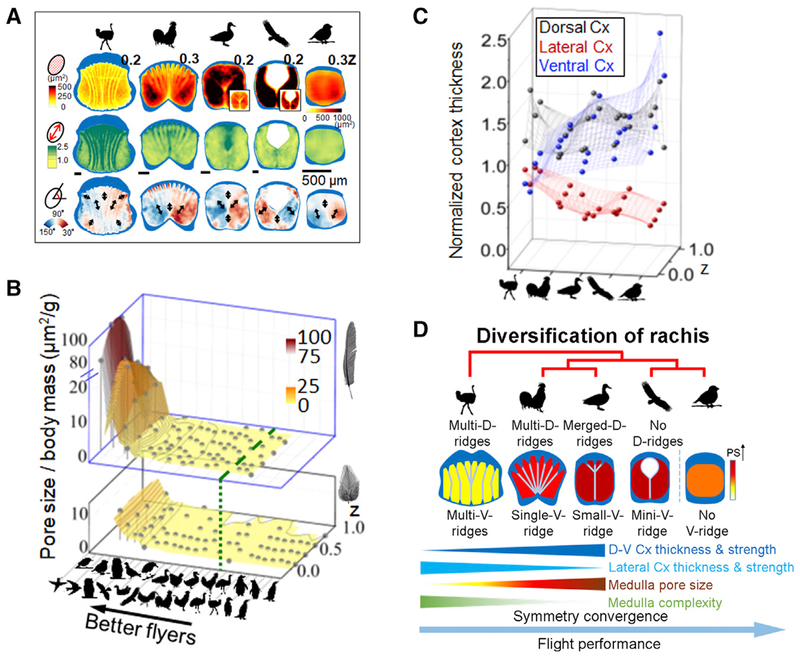
Figure 2. The Internal Architectures of Flight Feather Rachides Are Distinct in Birds Using Different Flight Modes.
(A) Flight feather rachides from birds representing five different flight modes analyzed with quantitative morphogenetic field (QMorF) analyses demonstrate the cortex-medulla integration. Three parameters shown from top to bottom rows: distributions of pore size (PS), degree of pore elongation (PEL, i.e., aspect ratio), and pore orientation (PO). Black arrows show polarity of local stresses on vacuoles during morphogenesis. Medulla cell bands stand out as they are composed of medulla vacuole collectives with similar size, shape, and orientation.
(B) Cross species analyses of mean PS normalized by body mass (z axis), in birds with different flight abilities (x axis, high performance flyers, left. Green dashed line marks boundary of flying and flightless birds). Changes along proximal-distal rachidian axes are analyzed (y axis). Pore size/body mass values drop rapidly in flight (top level), but mildly in contour feathers (bottom level).
(C) Cortex changes in birds with different flight abilities. Y coordinate represents mean normalized cortex thickness (NCT) of the rachis. Values along z axis (proximal-distal axis of rachis) are shown.
(D) Trends of symmetrical convergence of rachis topology. Cx, cortex; D, dorsal; V, ventral.
See also Figures S2 and S3.

