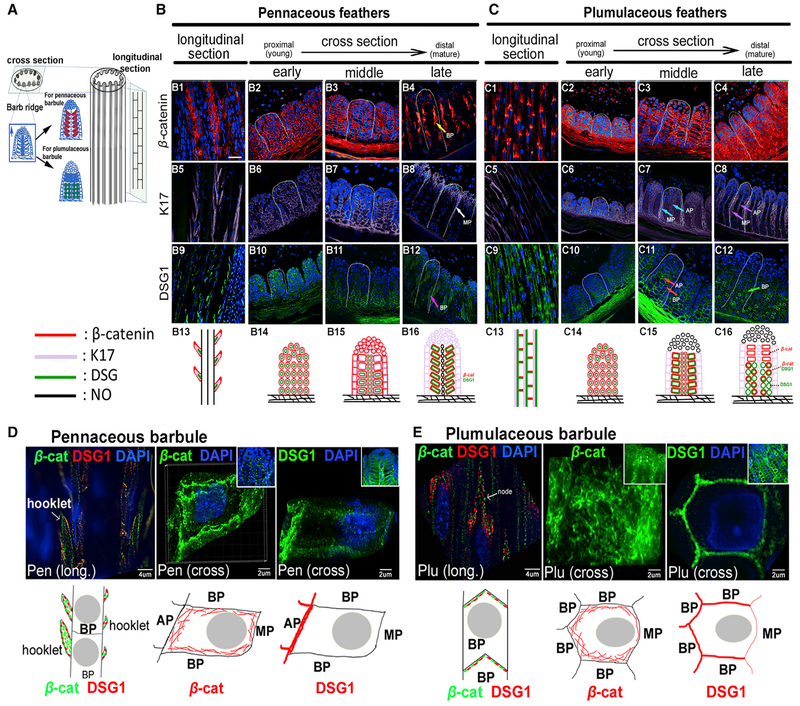
Figure 4. The Morphology of Pennaceous and Plumulaceous Feather Branches Are Marked by Distinct Distributions of Cell Adhesion Molecules and the Cytoskeleton.
(A) Feather filament schematic drawing showing epithelial cell arrangements in barb ridge. Undifferentiated barbule primordial cells (blue) can become either pennaceous barbules (red) or plumulaceous barbules (green).
(B and C) Expression patterns of β-cat, K17, and DSG1 are shown in longitudinal and cross-sections in pennaceous (B) or plumulaceous (C) feather branches. White dashed lines outline one barb ridge unit. Bottom panels (B13–B16, and C13–C16) summarize the dynamic molecular expression in each barb region. Stained samples were pseudocolored red (β-cat) and purple (K17) using Photoshop. Images showing DSG1 staining kept the original green color. Expression patterns of these molecules are shown in the schematic diagram using the same colors. No expression is shown in black. Multiple molecule expression is represented with two or three adjacent colors. Scale bar, 15 μm (B).
(D and E) Super resolution microscopy (SIM) imaging of β-cat and DSG1 immunostaining in pennaceous (D) and plumulaceous (E) feather barbules. Insets show lower magnification views. Bottom panels show schematic drawings of each molecule’s expression in one barbule cell. Arrows indicate feather branch components. AP, axial plate cell; β-cat, β-catenin; BP, barbule plate cell; Cross, cross section; DAPI, 4′,6-diamidino-2-phenylindole; DSG1, desmoglein 1; K17, keratin 17; Long, longitudinal section; MP, marginal plate cell; Pen, pennaceous barbule; Plu, plumulaceous barbule.
See also Figure S5.

