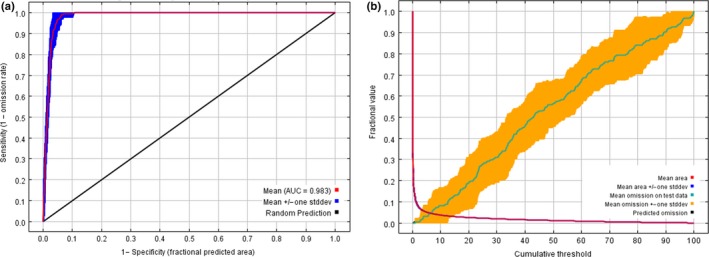
Figure 3.

Statistical graphs of MaxEnt model output results. (a) is the receiver operating characteristic (ROC) curve and average test AUC for accuracy analysis of risk prediction by MaxEnt model and (b) is the analysis of test omission rate and predicted area, where values indicate the training gain only with variables
