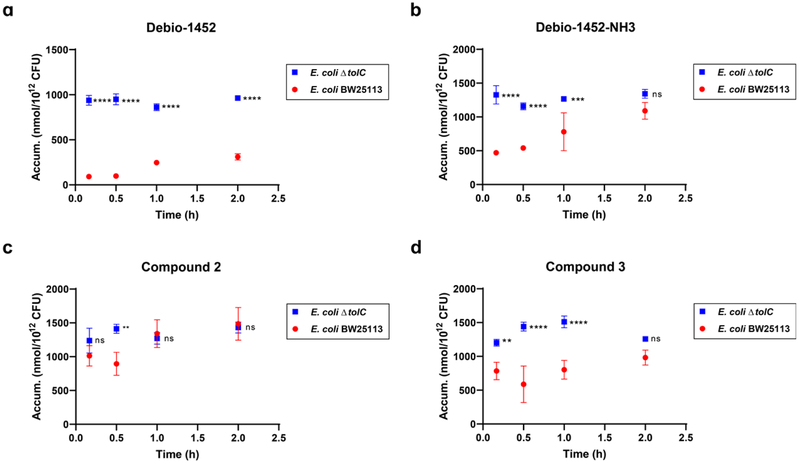
Extended Data Fig. 6. Time-course accumulation of Debio-1452 and derivatives in E. coli BW25113 and E. coli ΔtolC JW5503.
a. Debio-1452 accumulation over time. b. Debio-1452-NH3 accumulation over time. c. Compound 2 accumulation over time. d. Compound 3 accumulation over time. Bacterial cells were washed with and suspended in PBS. Cells were exposed to compound (50 μM final) and incubated at 37°C with shaking for 10 min, 30 min, 1 h, and 2 h. All cells were viable at these time points. Extra-cellular compound was removed, cells were lysed, and amount of compound in lysate was quantified by LC-MS/MS. Accumulation reported in nmol per 1012 colony-forming units (CFUs). Data shown represents the average of three independent experiments. Error bars represent standard deviation of the mean. Measurements were compared by ordinary two-way ANOVA. Sidak’s multiple comparisons test was used to compare compounds at each timepoint. Statistical significance of E. coli ΔtolC data points relative to E. coli BW25113 data points is indicated with asterisks (ns, not significant when p > 0.05 (b, 2.0 h, p = 0.0897; c, 10 min, p = 0.3571; c, 1.0 h, p = 0.9728; c, 2.0 h, p = 0.9894; d, 2.0 h, p = 0.0791), ** p < 0.01, *** p < 0.001, **** p < 0.0001).

