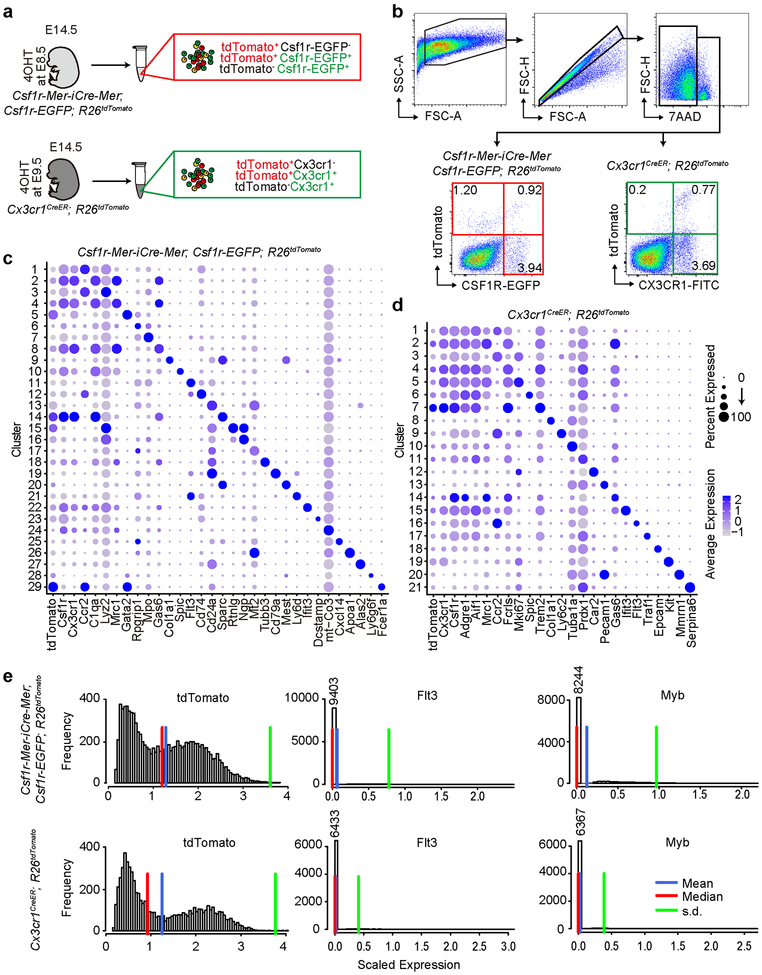
Extended Data Fig. 4.
Single cell RNA-sequencing analysis of E14.5 embryo. (a) Schematic representation of sample preparation for the single cell RNA-sequencing. 4OHT, 4-hydroxytamoxifen. (b) Cell sorting strategy for the single cell RNA-sequencing. tdTomato+EGFP-, tdTomato+EGFP+, and tdTomato-EGFP+ (red box) were isolated from whole-body cell suspension of Csf1r-Mer-iCre-Mer; Csf1r-EGFP; R26tdTomato mice labeled at E8.5. tdTomato+CX3CR1-, tdTomato+CX3CR1+, and tdTomato-CX3CR1+ cell populations (green box) were also isolated from E14.5 Cx3cr1CreER; R26tdTomato mice labeled at E9.5. Two biological replicates of each genotype. (c) Dot plot showing expression of the selected marker gene in each cluster of Csf1r-Mer-iCre-Mer; Csf1r-EGFP; R26tdTomato mice. The size of the dot encodes the percentage expression, and its color encodes the average expression level. (d) Dot plot showing expression of the selected marker gene in each cluster of Cx3cr1CreER; R26tdTomato mice. (e) Scaled expression level and frequency (the number of cells) of tdTomato, Myb, and Flt3 were visualized. tdTomato+ cells from Csf1r-Mer-iCre-Mer; Csf1r-EGFP; R26tdTomato (n=10,336 cells) and Cx3cr1CreER; R26tdTomato (n=6,706 cells) mice were evaluated.

