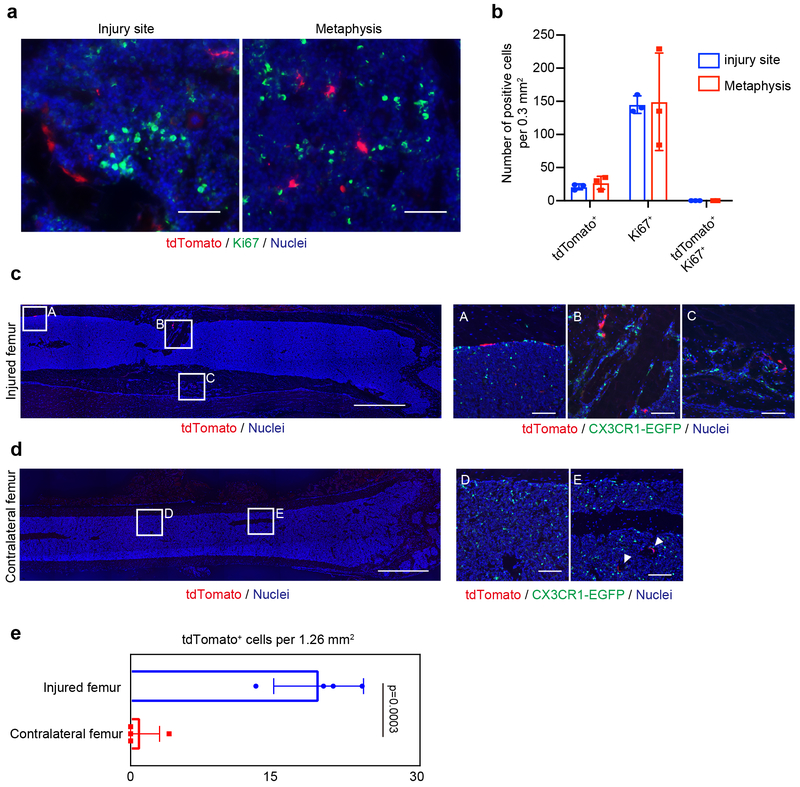
Extended Data Fig. 7.
Migration of EMP-derived osteoclast precursors through the blood circulation. (a) Immunohistochemical analysis for Ki67 expression. Representative images showing Ki67+ and tdTomato+ cells around the injury site and adjacent metaphysis at day 14 (n=3 mice per group). Scale bars, 50 μm. (b) The number of single positive cells of Ki67 and tdTomato and double-positive cells per 0.3 mm2 were quantified (n=3 mice per group). Error bars denote means ± s.d. (c) Representative images of the injured femur of Cx3cr1EGFP/+ mice after the parabiotic union. tdTomato+ cells migrated through the blood circulation at the site of a bone injury. Scale bars, 1 mm. Right panels showing enlarged images (n=4 independent parabiotic pairs). Scale bars, 100 μm. (d) Representative images of uninjured side femur of Cx3cr1EGFP/+ mice. Scale bars, 1 mm. Right panels showing enlarged images (n = 4 independent parabiotic pairs). White triangles indicating tdTomato+ cells. Scale bars, 100 μm. (e) The number of tdTomato+ cells around the injury site and contralateral side of the femur. tdTomato+ cells per 1.26 mm2 were counted and visualized by bar chart (n = 4 mice per group). Unpaired two-tailed t-test. Error bars denote means ± s.d. Statistics source data are provided in Source Data Extended Data Fig. 7.

