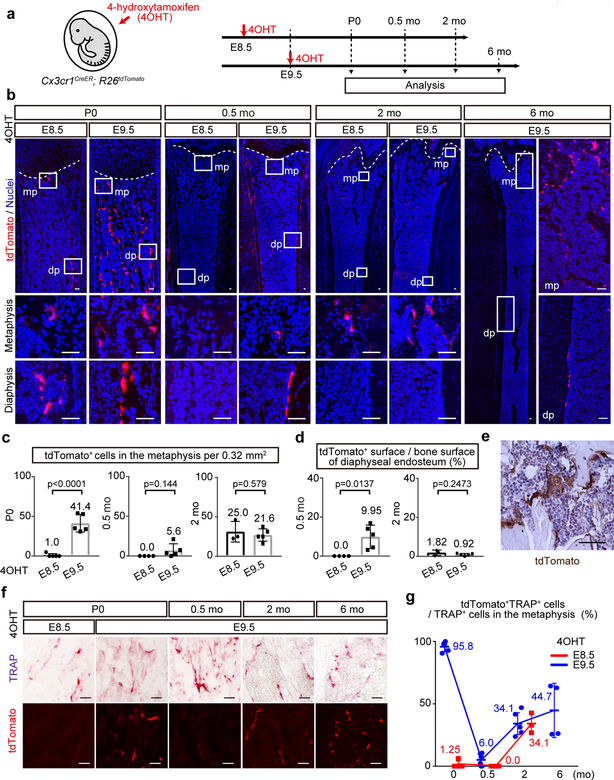
Figure 2. Cx3cr1+ yolk-sac macrophages give rise to the osteoclasts that survive in adulthood.
(a) Schematic representation of the fate-mapping analysis of Cx3cr1-expressing cells and their progenies. E, embryonic day. P, postnatal day. mo, month-old. 4OHT, 4-hydroxytamoxifen. (b) Representative images of tdTomato expressing cells on the postnatal femur at P0 (E8.5, n=5; E9.5, n=5), 0.5 mo (E8.5, n=4; E9.5, n=5), 2 mo (E8.5, n=3; E9.5, n=5), and 6 mo (E9.5, n=4). n representing independent animals. mp, metaphysis. dp, diaphysis. Scale bars, 50 μm. (c) The number of tdTomato+ cells in the metaphysis per 0.32 mm2 at P0 (E8.5, n=5; E9.5, n=5), 0.5 mo (E8.5, n=4; E9.5, n=5), and 2 mo (E8.5, n=3; E9.5, n=5). n representing independent animals. Unpaired two-tailed t-test. Error bars denote means ± s.d. (d) Percentage of tdTomato+ surface area to the total bone surface area of the endosteum at 0.5 mo (E8.5, n=4; E9.5, n=5) and 2 mo (E8.5, n=3; E9.5, n=5). n representing independent animals. Unpaired two-tailed t-test. Error bars denote means ± s.d. (e) Representative image of immunostaining for tdTomato indicating the multinucleation of tdTomato+ cells from three independent experiments. Scale bar, 50 μm. (f) Representative images of tdTomato+ and TRAP+ cells on the postnatal femur at defined age and time point of 4OHT induction (E8.5; P0, n=5. E9.5; P0, n=5; 0.5 mo, n=5; 2 mo, n=5; 6 mo, n=4). n representing independent animals. Scale bars, 50 μm. (g) Percentage of tdTomato+TRAP+ cells to total TRAP+ cells in the metaphysis (E8.5; P0, n=5; 0.5 mo, n=4; 2 mo, n=3. E9.5; P0, n=5; 0.5 mo, n=5; 2 mo, n=5; 6 mo, n=4). n representing independent animals. Error bars denote means ± s.d. Statistics source data are provided in Source Data Fig. 2.

