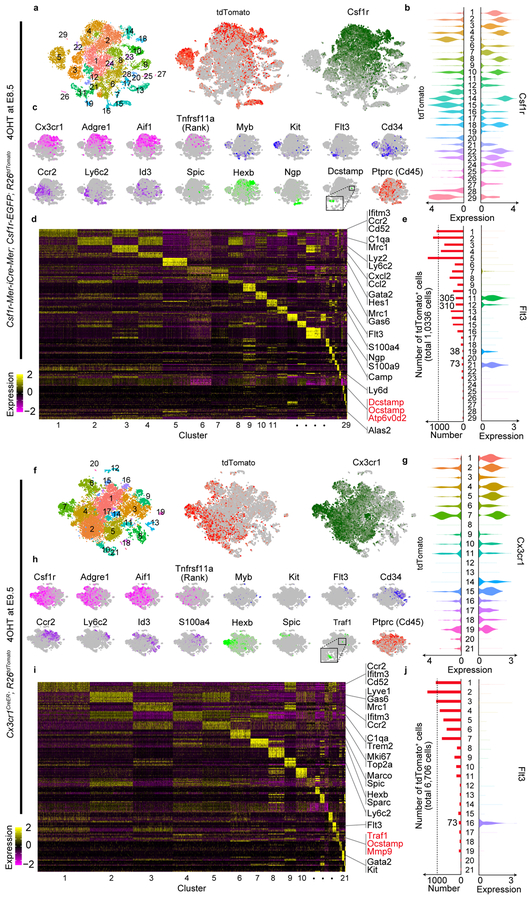
Figure 4. EMP- and HSC-derived cells specify distinct subpopulations.
(a) t-distributed stochastic neighbor embedding (t-SNE) plot of 19,598 cells from Csf1r-Mer-iCre-Mer; Csf1r-EGFP; R26tdTomato mice (n=2 mice) identified 29 clusters. (b) Violin plots showing Csf1r and tdTomato expression levels of the cells from Csf1r-Mer-iCre-Mer; Csf1r-EGFP; R26tdTomato mice (n=2 mice). The number in the middle column show cluster identity and the number of cells in each cluster is provided in Statistical source data Fig. 4. (c) Normalized expression of indicated marker genes was visualized onto t-SNE plots of 19,598 cells from Csf1r-Mer-iCre-Mer; Csf1r-EGFP; R26tdTomato mice (n=2 mice). (d) Heatmap representing the top 10 significantly differentially expressed genes in each cluster. (e) The number of tdTomato+ cells in each cluster are shown with the expression level of Flt3. The number in the middle column show cluster identity and the number of cells and tdTomato+ cells in each cluster are provided in Statistical source data Fig. 4. (f) t-SNE plot of 16,169 cells from Cx3cr1CreER; R26tdTomato mice (n=2 mice) provided 21 clusters. (g) Violin plots showing Cx3cr1 and tdTomato expression levels of the cells from Cx3cr1CreER; R26tdTomato mice (n=2 mice). The number in the middle column show cluster identity and the number of cells in each cluster is provided in Statistical source data Fig. 4. (h) Normalized expression of indicated marker genes was visualized onto t-SNE plots of 16,169 cells from Cx3cr1CreER; R26tdTomato mice (n=2 mice). (i) Heatmap representing the top 10 significantly differentially expressed genes in each cluster. (j) The number of tdTomato+ cells in each cluster are shown with the expression level of Flt3. The number in the middle column show cluster identity and the number of cells and tdTomato+ cells in each cluster are provided in Statistical source data Fig. 4. Statistics source data are provided in Source Data Fig. 4.

