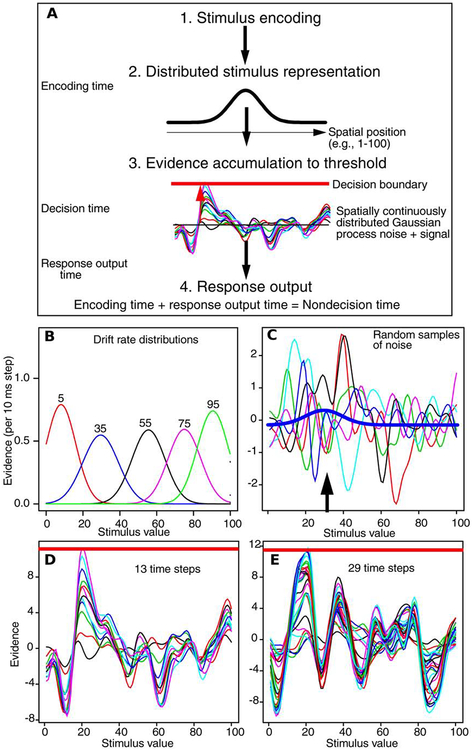
Figure 2.
A: An illustration of processes in the SCDM. The stimulus is encoded to produce a drift-rate distribution, this along with samples of noise is accumulated to the decision threshold, then the point at which the process terminates is used to generate a response. The black arrows represent the progression of processing over time. B: Five example drift-rate distributions. The parameters used for these distributions were the means and SDs from fits to Experiment 1 (from Table 1). C: The drift-rate distribution (solid blue line) and samples of Gaussian process noise, all to the same scale. The black arrow points to the peak of the drift-rate distribution. D and E: These show two examples of a single trial with a drift-rate distribution mean of 20. The decision criterion line (solid red line at the top of each figure) differs because of trial to trial variability in the setting.

