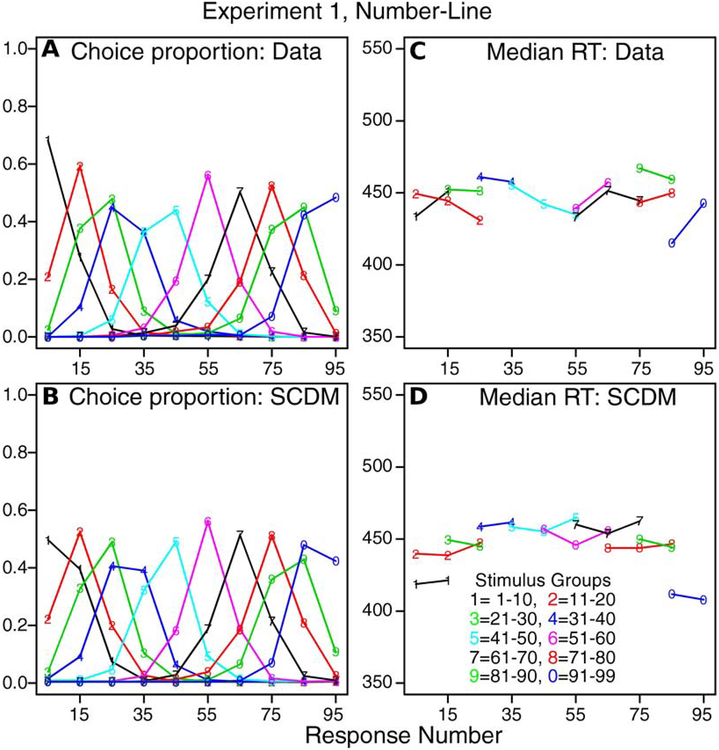
Figure 4.
A: Values of choice proportions from experimental data from Experiment 1 (number-line task) for 10 stimulus groups and 10 response groups averaged over subjects. B: Predicted values of choice proportions from the SCDM for the same grouping as in A and averaged over subjects in the same way. C: Values of median RTs for the same groups as in panel A. Only values are shown when all subjects contribute values to the medians. D: Values of median RTs matching those in panel C.

