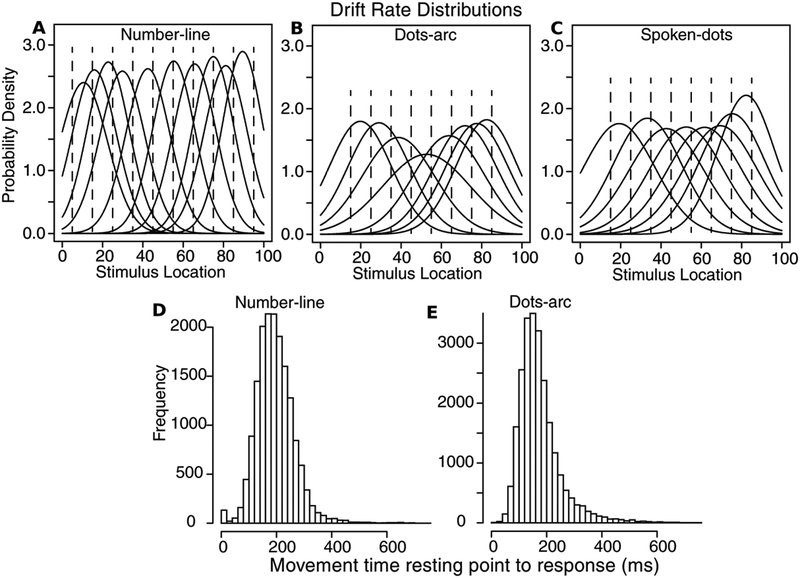
Figure 7.
A, B, C: Drift rate distributions for Experiments 1, 2, and 3, respectively, from the SCDM using parameter values averaged over subjects that are shown in Table 1. D and E: Movement time distributions averaged over all subjects and all conditions for Experiments 1 and 2 respectively. The distribution for Experiment 1 is a little wider than that for Experiment 2 because of longer travel times for Experiment 1 for the ends of the number line (see Figure 1A and 1B).

