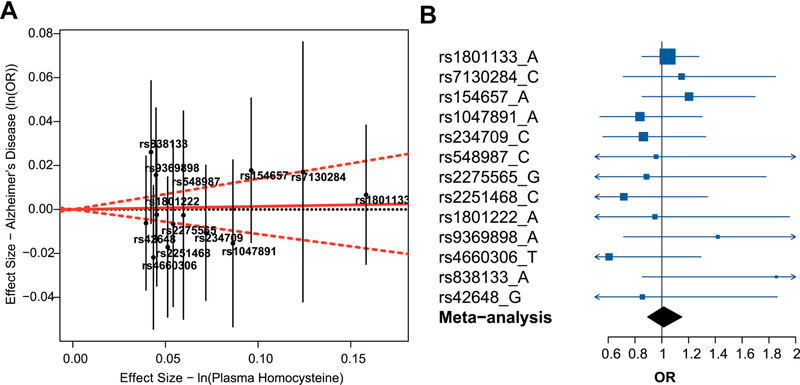
Fig. 2.
Mendelian randomization analysis of the effect of plasma homocysteine on AD risk using summarized data. (A) The effect sizes of polymorphisms affecting plasma homocysteine on natural log-transformed homocysteine levels and risk for AD. Effect sizes for plasma homocysteine are extracted from van Meurs et al. (2013) and for AD risk are obtained from summary statistics from IGAP (Lambert et al., 2013). The effect estimate of plasma homocysteine on AD risk is represented by the red solid line. The 95% CI of this estimate is represented by the red dashed lines. The plot is created using the “gtx” package in R. (B) Mendelian randomization estimates for the effect of 1-standard deviation increase in genetically determined plasma homocysteine on AD risk (OR and 95% CI) are demonstrated for each plasma homocysteine risk allele (dark blue) and the overall fixed-effect meta-analysis of all alleles (black). Abbreviations: AD, Alzheimer’s disease; CI, confidence interval; IGAP, International Genomics of Alzheimer’s Project; OR, odds ratio.

