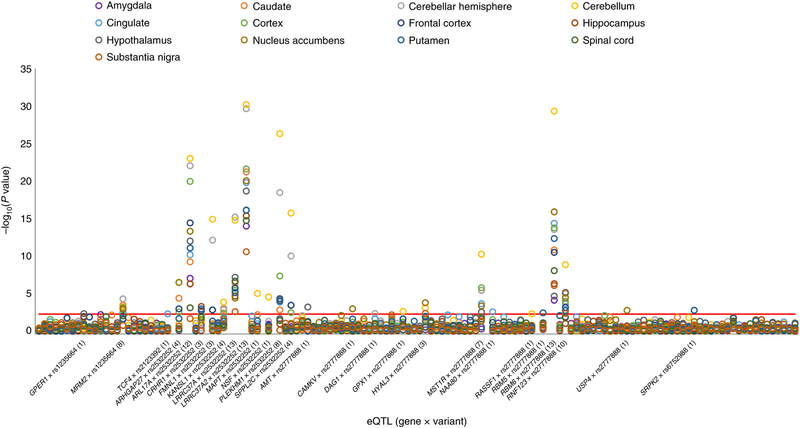
Figure 3:
eQTLs observed with respect to the eight GWS variants identified in EUR meta-analysis (N=146,660) considering protein-coding genes and 13 brain tissues. The eQTL IDs (x-axis, gene*variant) are reported only for those with at least one result surviving FDR multiple testing correction. Negative logarithm of the association two-sided p value for each eQTL tested is reported on the y-axis. The number reported between parentheses in each eQTL corresponds to the significant results observed with respect to the 13 brain tissues tested. The red line corresponds to the FDR multiple testing correction (q<5%).

