Figure 2.

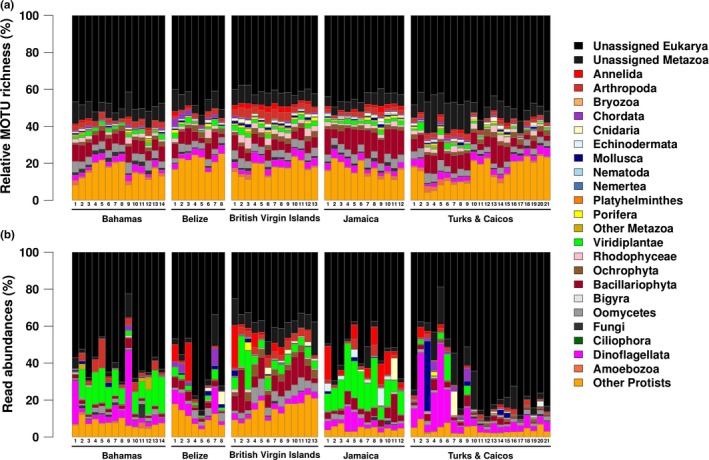
(a) Relative MOTU richness; the relative number of MOTUs assigned to the different phyla per sample, per location, and (b) relative number of reads of each of the different phyla, per sample, per location

(a) Relative MOTU richness; the relative number of MOTUs assigned to the different phyla per sample, per location, and (b) relative number of reads of each of the different phyla, per sample, per location