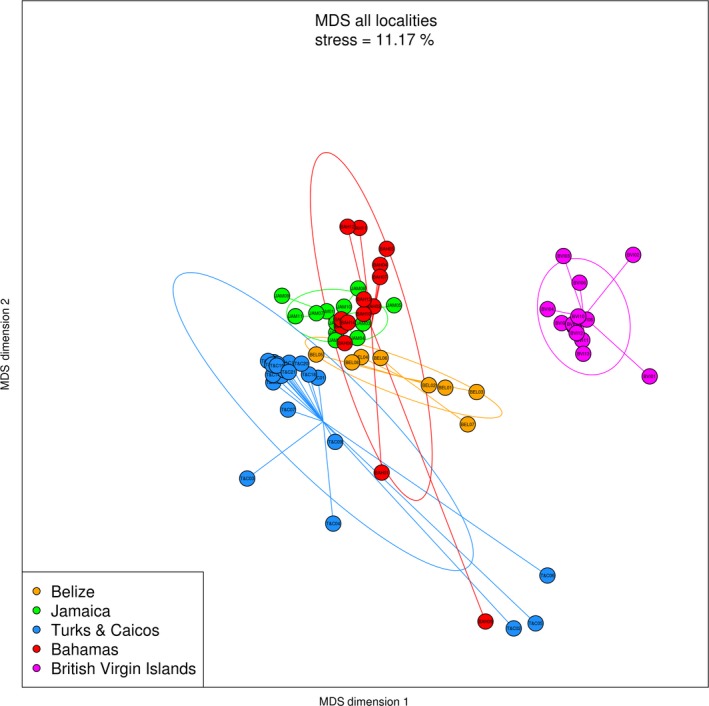
Figure 3.

Non‐metric multidimensional scaling (nMDS) plot (Bray–Curtis, based on relative MOTU read abundances) showing the ordination pattern for the five sampling locations. Pair‐wise comparisons indicate significant differences in MOTU diversity between all the locations (F = 7.08, df = 4, p < .001)
