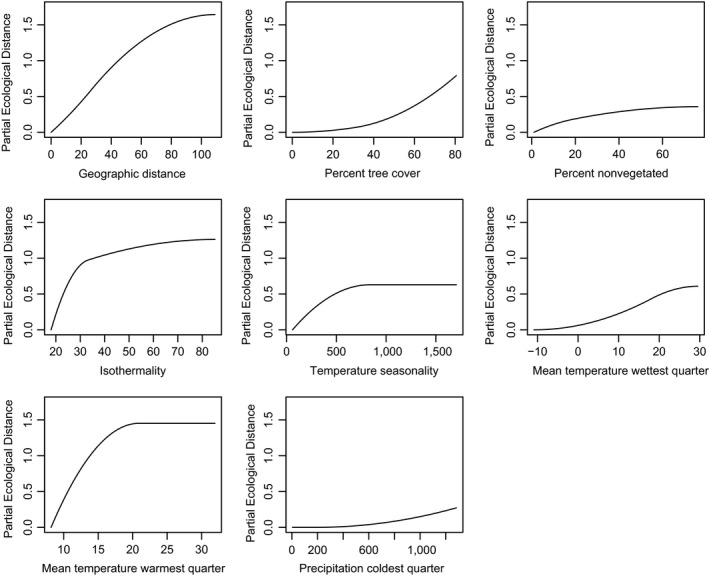
Figure 4.

For N. & C. America, I‐splines for significant individual geographic or environmental variables from the fitted generalized dissimilarity modeling. Y‐axis shows the partial ecological distance, that is, the magnitude of compositional change according to the environmental gradient
