
Figure 1.
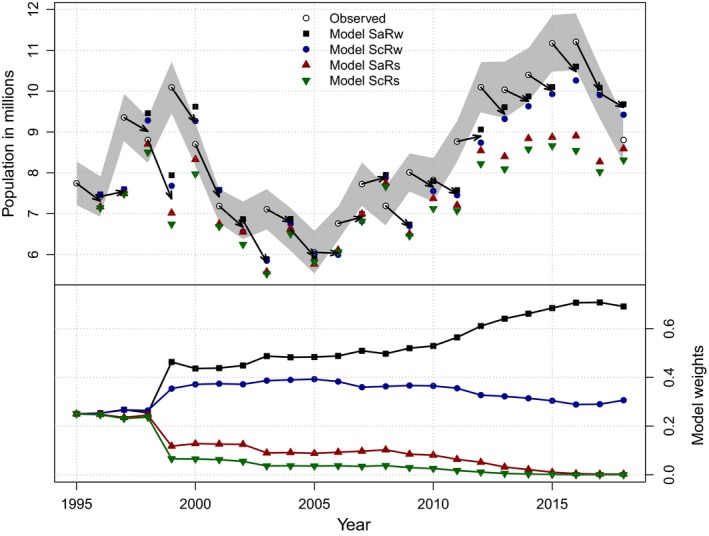
Upper panel: population estimates of mid‐continent mallards (in millions) compared to predictions of each member of the model set (SaRw = additive mortality and weakly density‐dependent reproduction, ScRw = compensatory mortality and weakly density‐dependent reproduction, SaRs = additive mortality and strongly density‐dependent reproduction, ScRs = compensatory mortality and strongly density‐dependent reproduction). The gray shading represents 95% confidence intervals for observed population estimates. The arrow represents a weighted mean annual prediction based on the entire model set. Lower panel: annual changes in model weights for each member of the mid‐continent mallard model set; weights were assumed to be equal in 1995