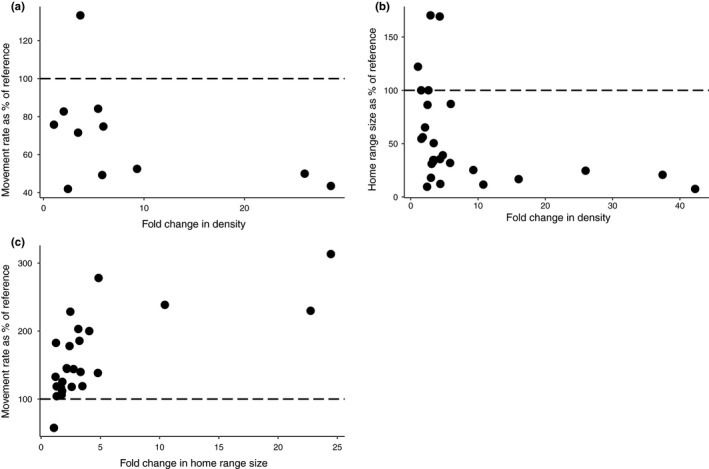
Figure 2.

(a) Movement rate in a higher density population expressed as a percentage of the lower density population's movement rate (i.e., reference value). 100% represents no change in movement rate. Points that fall below the 100% line indicate a drop in movement rate over a given change in density; points that fall above the 100% line indicate an increase in movement rate over a given change in density. N = 11 studies. (b) Home‐range size in a higher density population expressed as a percentage of the lower density population's home range (i.e., reference value). N = 26 studies. (c) Movement rate in a population with larger home ranges expressed as a percentage of the smaller home‐range population's movement rate (i.e., reference value). N = 25 studies
