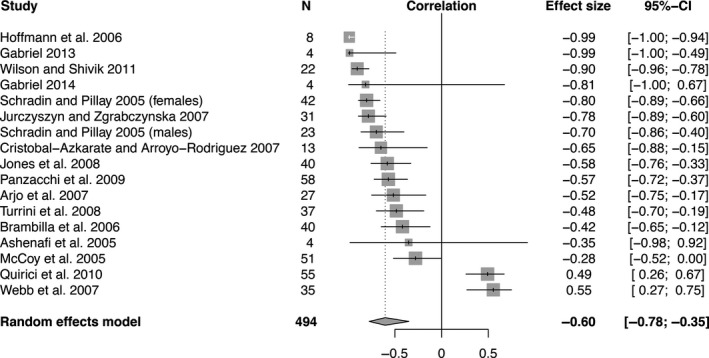
Figure 4.

Forest plot indicating the mean effect size (correlation coefficient) of studies that reported home‐range sizes across different densities. The effect size is significant if its 95% confidence interval (the black bar) does not overlap zero. Negative correlation coefficients indicate that home ranges are smaller at higher densities. The diamond indicates the overall effect size as determined by a random effects model
