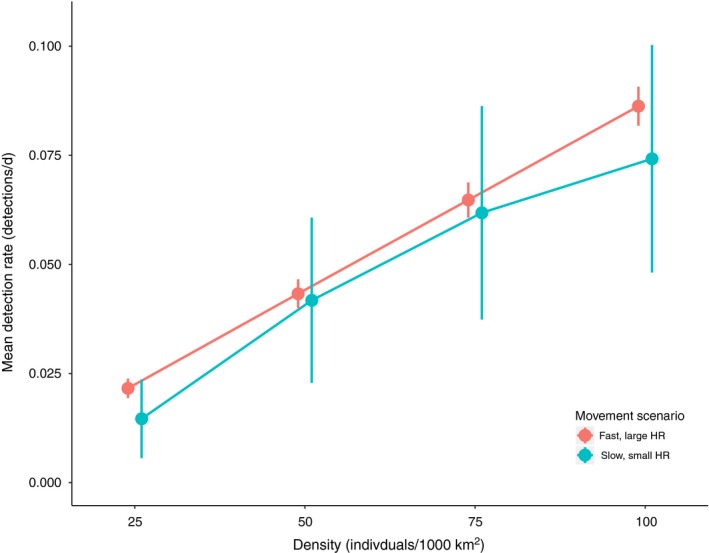
Figure 6.

Mean detection rate under different densities and movement scenarios. Movement scenarios represent home‐range sizes and movement rates that covary and encompass the possible range in behavior as seen in the meta‐analysis. Populations of 25, 50, 75, and One hundred individuals were simulated in a 1,000 km2 domain. The fast movement, large home‐range scenario is indicated in red (realized speed 180 m/hr, steady‐state home range 100 km2) while the slow movement, small home‐range scenario is indicated in blue (realized speed 57 m/hr, steady‐state home range 1 km2). Detection rates represent the mean detection rate across 1,000 randomly placed cameras over a time span of 6 months. Error bars represent 95% confidence intervals
