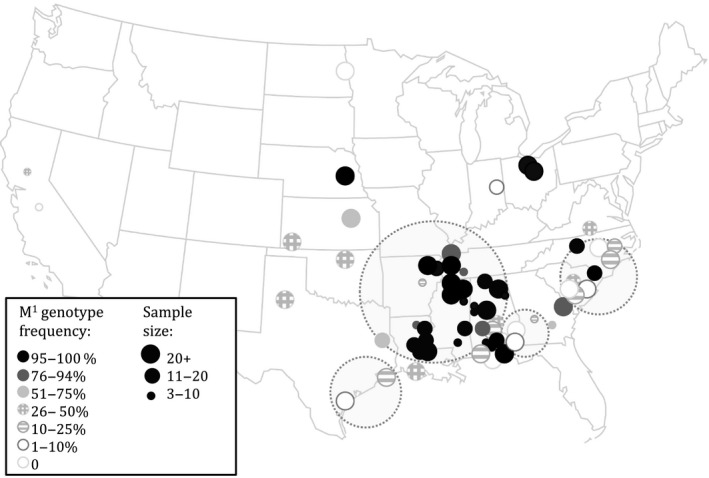
Figure 3.

The present‐day distribution of the M1 element in the United States is patchy, with several significant clusters of high or low M1 frequency. Dotted circles indicate sites clustered by M1 allele frequency by SaTscan analysis. The color of the solid circle indicates the M1 genotype frequency of individuals sampled from that site, while the size of the circle is proportional to the number of individuals genotyped
