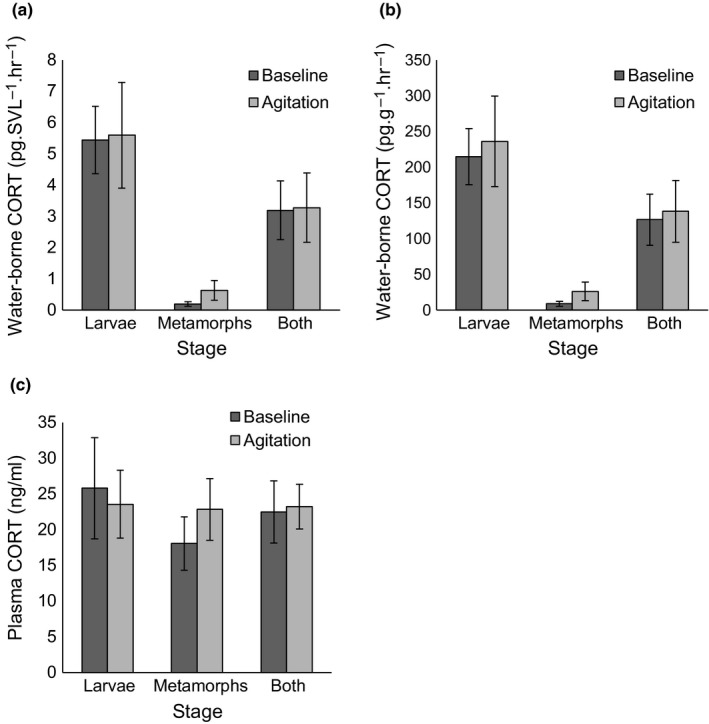
Figure 3.

Graphs displaying untransformed corticosterone (CORT) ± SE for spotted salamander baseline and agitation groups measured in different subsets of larvae (n = 8, 8), metamorphs (n = 6, 7), and both stages (n = 14, 15) combined for water‐borne CORT (a, b) and plasma levels (c)
