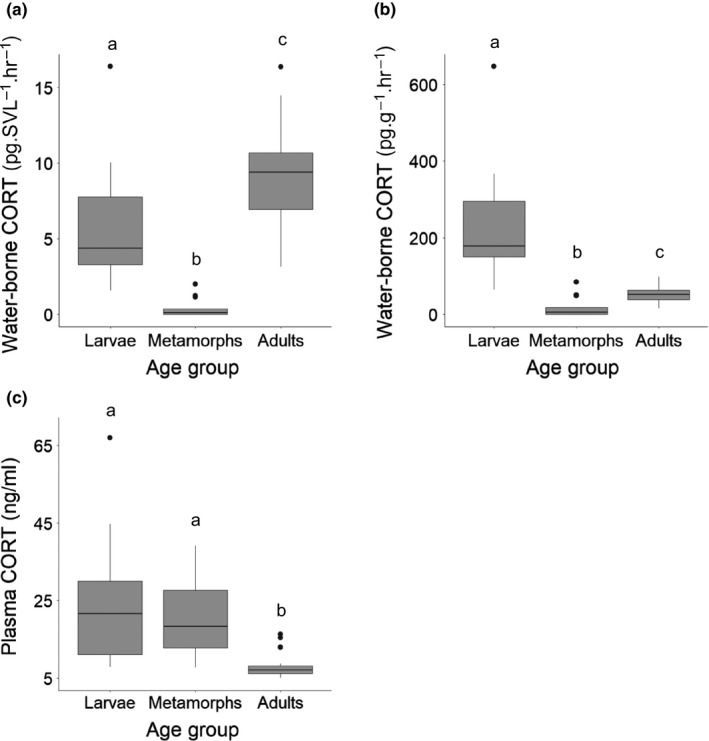
Figure 4.

Boxplots displaying the median, interquartile range, lowest and highest observations, and outliers for spotted salamander corticosterone (CORT) levels across age groups (larvae: n = 16, metamorphs: n = 13, adults: n = 28 [27 for water‐borne pg/g/hr]) for water‐borne CORT (a, b) and plasma CORT levels (c). Letters indicate differences in CORT levels between age groups (p < .01; Kruskal–Wallis chi‐square; Dunn test)
