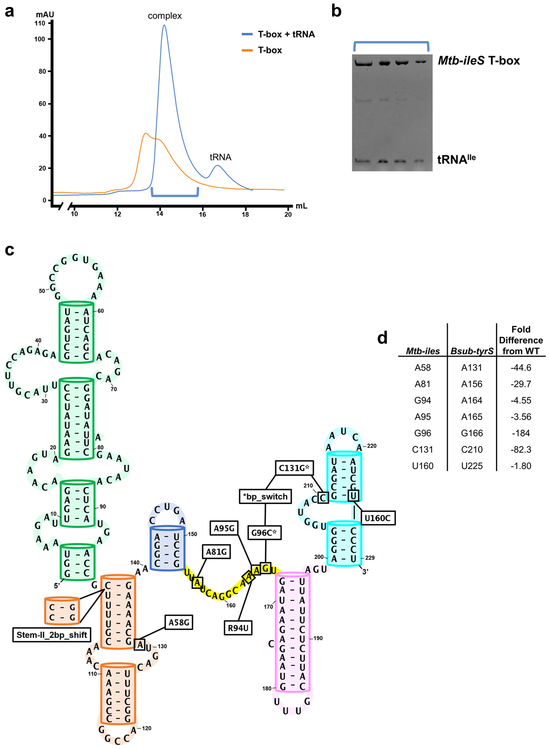
Extended Data Fig. 1. Size exclusion chromatographic analysis and mutagenesis guide.
a, Size exclusion chromatogram of Mtb-ileS folded with (blue) and without (orange) tRNAIle. b, Urea denaturing PAGE gel of peak fractions from T-box + tRNA peak. c, Secondary structure model of tyrS T-box from Bacillus subtilis (Bsub-tyrS). Boxes highlight location and identity of each mutation. d, Conversion table for residue notation in Mtb-ileS and Bsub-tyrS. Fold difference from WT is difference between the average of three induction measurements at 1 hour for WT versus mutation of indicated residue.

