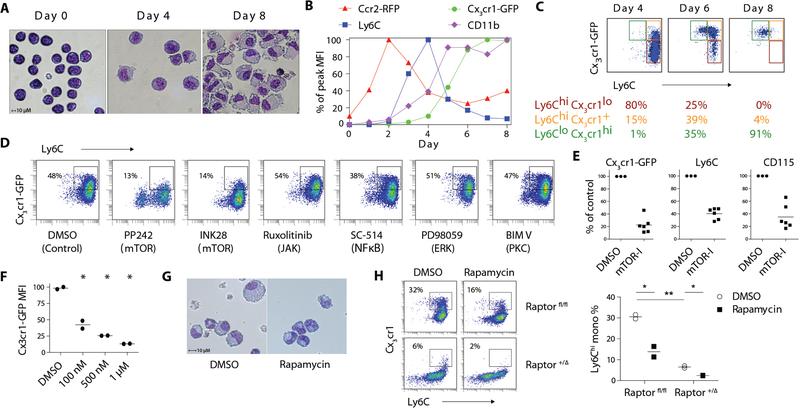
Figure 1. Small molecule library screen identifies an essential role of mTORC1 signaling in monocyte development.
A) Giemsa-Wright staining of ER-Hoxb8 cells before and after differentiation. B) Longitudinal FACS quantification of Cx3cr1-GFP, Ccr2-RFP, CD11b and Ly6C expression in DR-ER-Hoxb8 cells. MFI of each marker was normalized to the peak expression during the time course. C) FACS analysis of CD115+ DR-ER-Hoxb8 cells from day 4 to day 8 of differentiation. D) FACS plot of DR-ER-Hoxb8 cells differentiated in the presence of small molecule inhibitors. Boxes depict the percentage of Ly6Chi monocytes. E) MFI quantification of monocyte marker expression in DR-ER-Hoxb8 cells treated with mTOR inhibitors (mTOR-I) normalized to vehicle control (DMSO). Each data point for inhibitors (n = 6) represents a distinct compound. F) Dose-response curve of Cx3cr1-GFP expression in DR–ER–Hoxb8 cells treated with rapamycin (n = 2 per condition). G) Giemsa-Wright stain of DR-ER-Hoxb8 cells differentiated for 6 days in the presence of rapamycin (500 nM) or DMSO. H) FACS plots and quantification of monocyte production in Raptor fl/fl and +/Δ ER–Hoxb8 cells with or without rapamycin (500 nM; n = 2 per condition). Boxes indicate percentage of Ly6Chi monocytes. * p < 0.05

