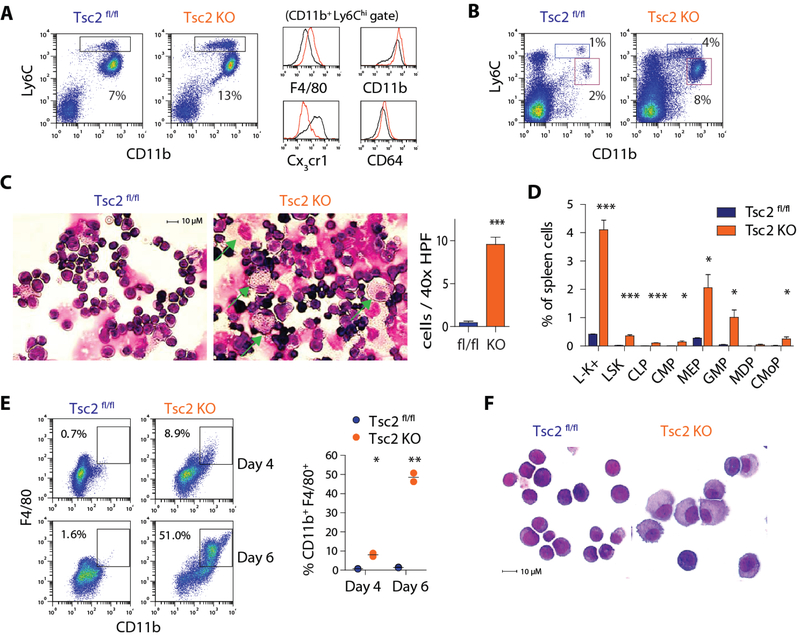
Figure 5. Deletion of Tsc2 enhances mTORC1 signaling and augments myelopoiesis.
A) FACS plots of bone marrow Ly6Chi monocytes (box) in Tsc2 KO and controls. Histograms depict myeloid marker expression in Ly6Chi monocytes. B) FACS plots of isolated spleen cells from Tsc2 KO and controls. Boxes indicate Ly6Chi monocytes (blue) and neutrophils (red). C) Giemsa-Wright staining of isolated spleen cells and quantification of large macrophages (arrow; n = 9 HPF counted per group from 3 animals). D) Quantification of splenic progenitor cell populations in Tsc2 KO and controls (n = 3 per group). E) FACS analysis and F) Giemsa-Wright staining of macrophages differentiated from sorted LSK cells from control or Tsc2 KO mice maintained in SCF-containing medium (10 ng/mL; n = 2 per condition). * p < 0.05, ** p < 0.01, *** p< 0.001

